Bitcoin Breakdown


SPY and QQQ simply chopped inside Thursday’s massive hammer candle on Friday, but they did so on heavy volume—actually eclipsing Thursday’s volume. That adds to the case that a break below Thursday’s hammer would be a major warning sign and would signal more weakness ahead.
Zooming out to the SPY monthly chart shows the true epic nature of this bull run. We see a massive bearish hammer in April at the low, followed by six strong bullish candles, then another bearish hammer that actually closed higher, followed by a slightly down month, yet still bullish candle, and then another bullish candle. Put more simply, the S&P 500 has only closed lower once in the past nine months—and that down month was just a 0.1% decline.
SPY Monthly
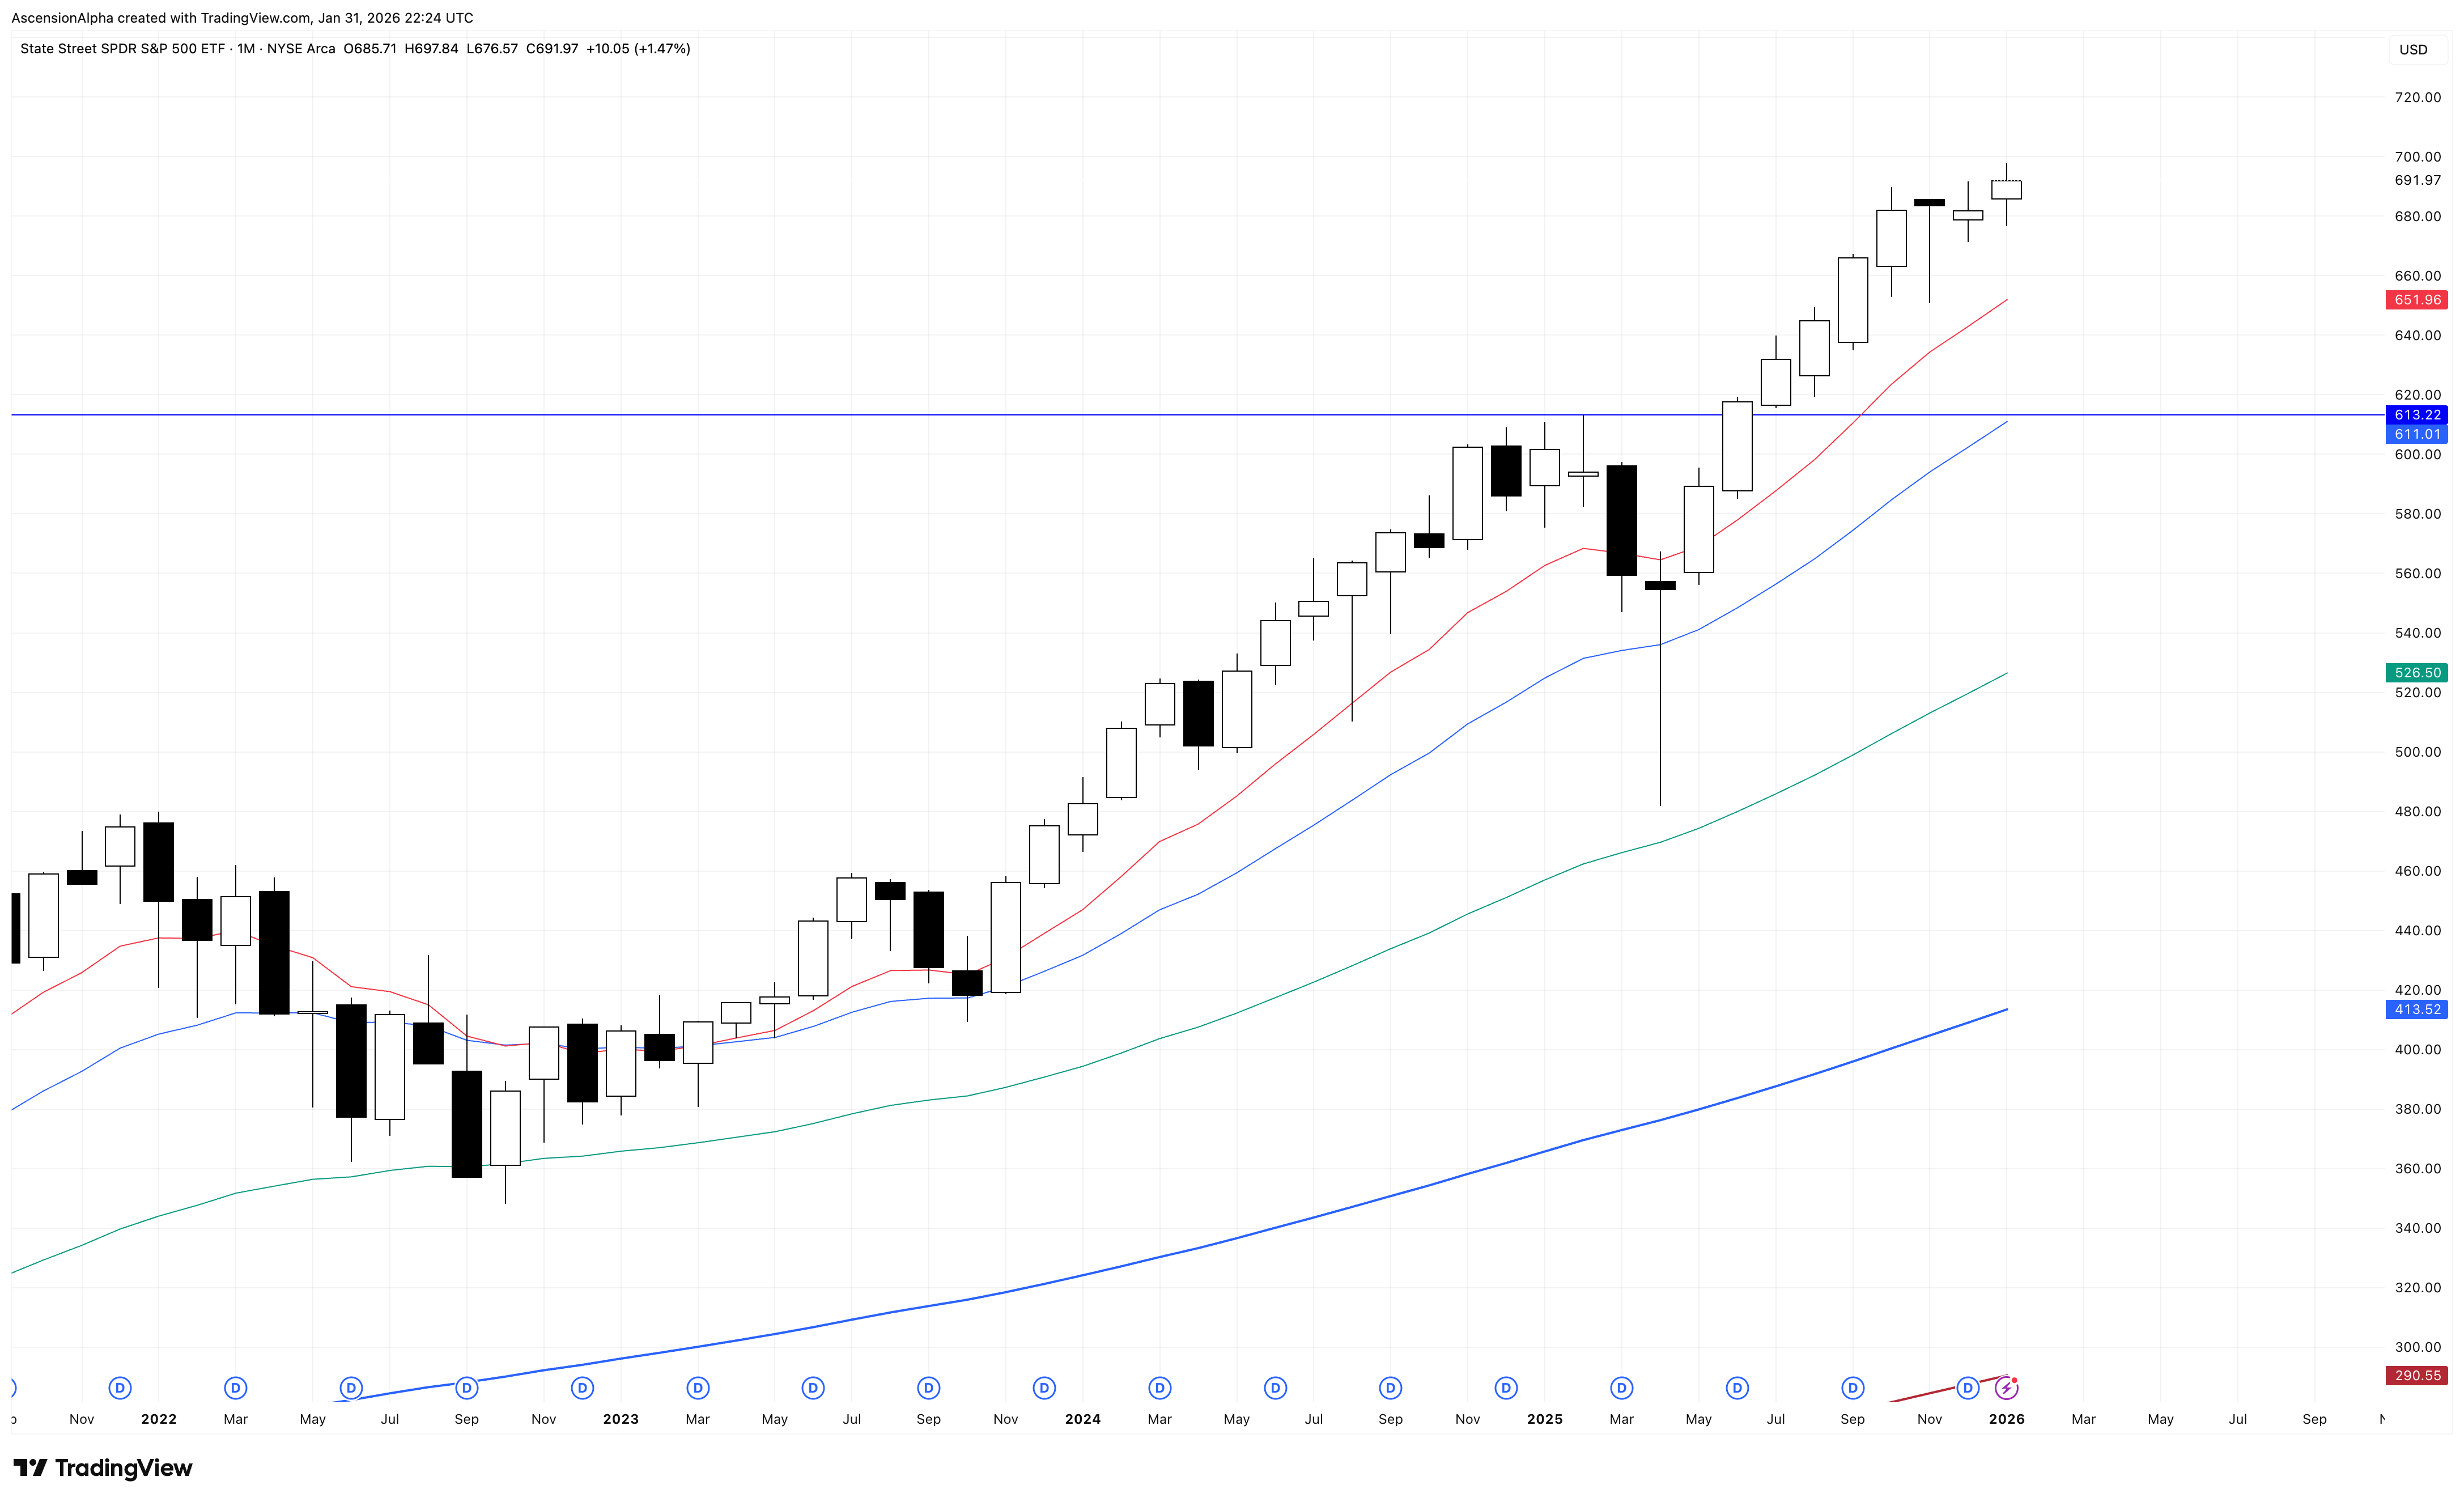
The bullish run has been impressive, but it’s starting to feel tired. Monthly bull candles are still forming, but they’re smaller and more muted, lacking the momentum and exuberance we saw last year. When you combine that with months-long bearish divergence, the dot-com analog, continued underperformance from the Magnificent Seven, topping behavior in the big banks, and several other factors I’ve been tracking and discussing, the market appears increasingly primed for some kind of pullback.
Yes, it’s entirely possible we make another high and print another bullish candle in February. But if we reach key targets and Fibonacci extensions, that would likely mark the end of a historically strong bull run and set the stage for a larger correction.
SPY Daily Chart
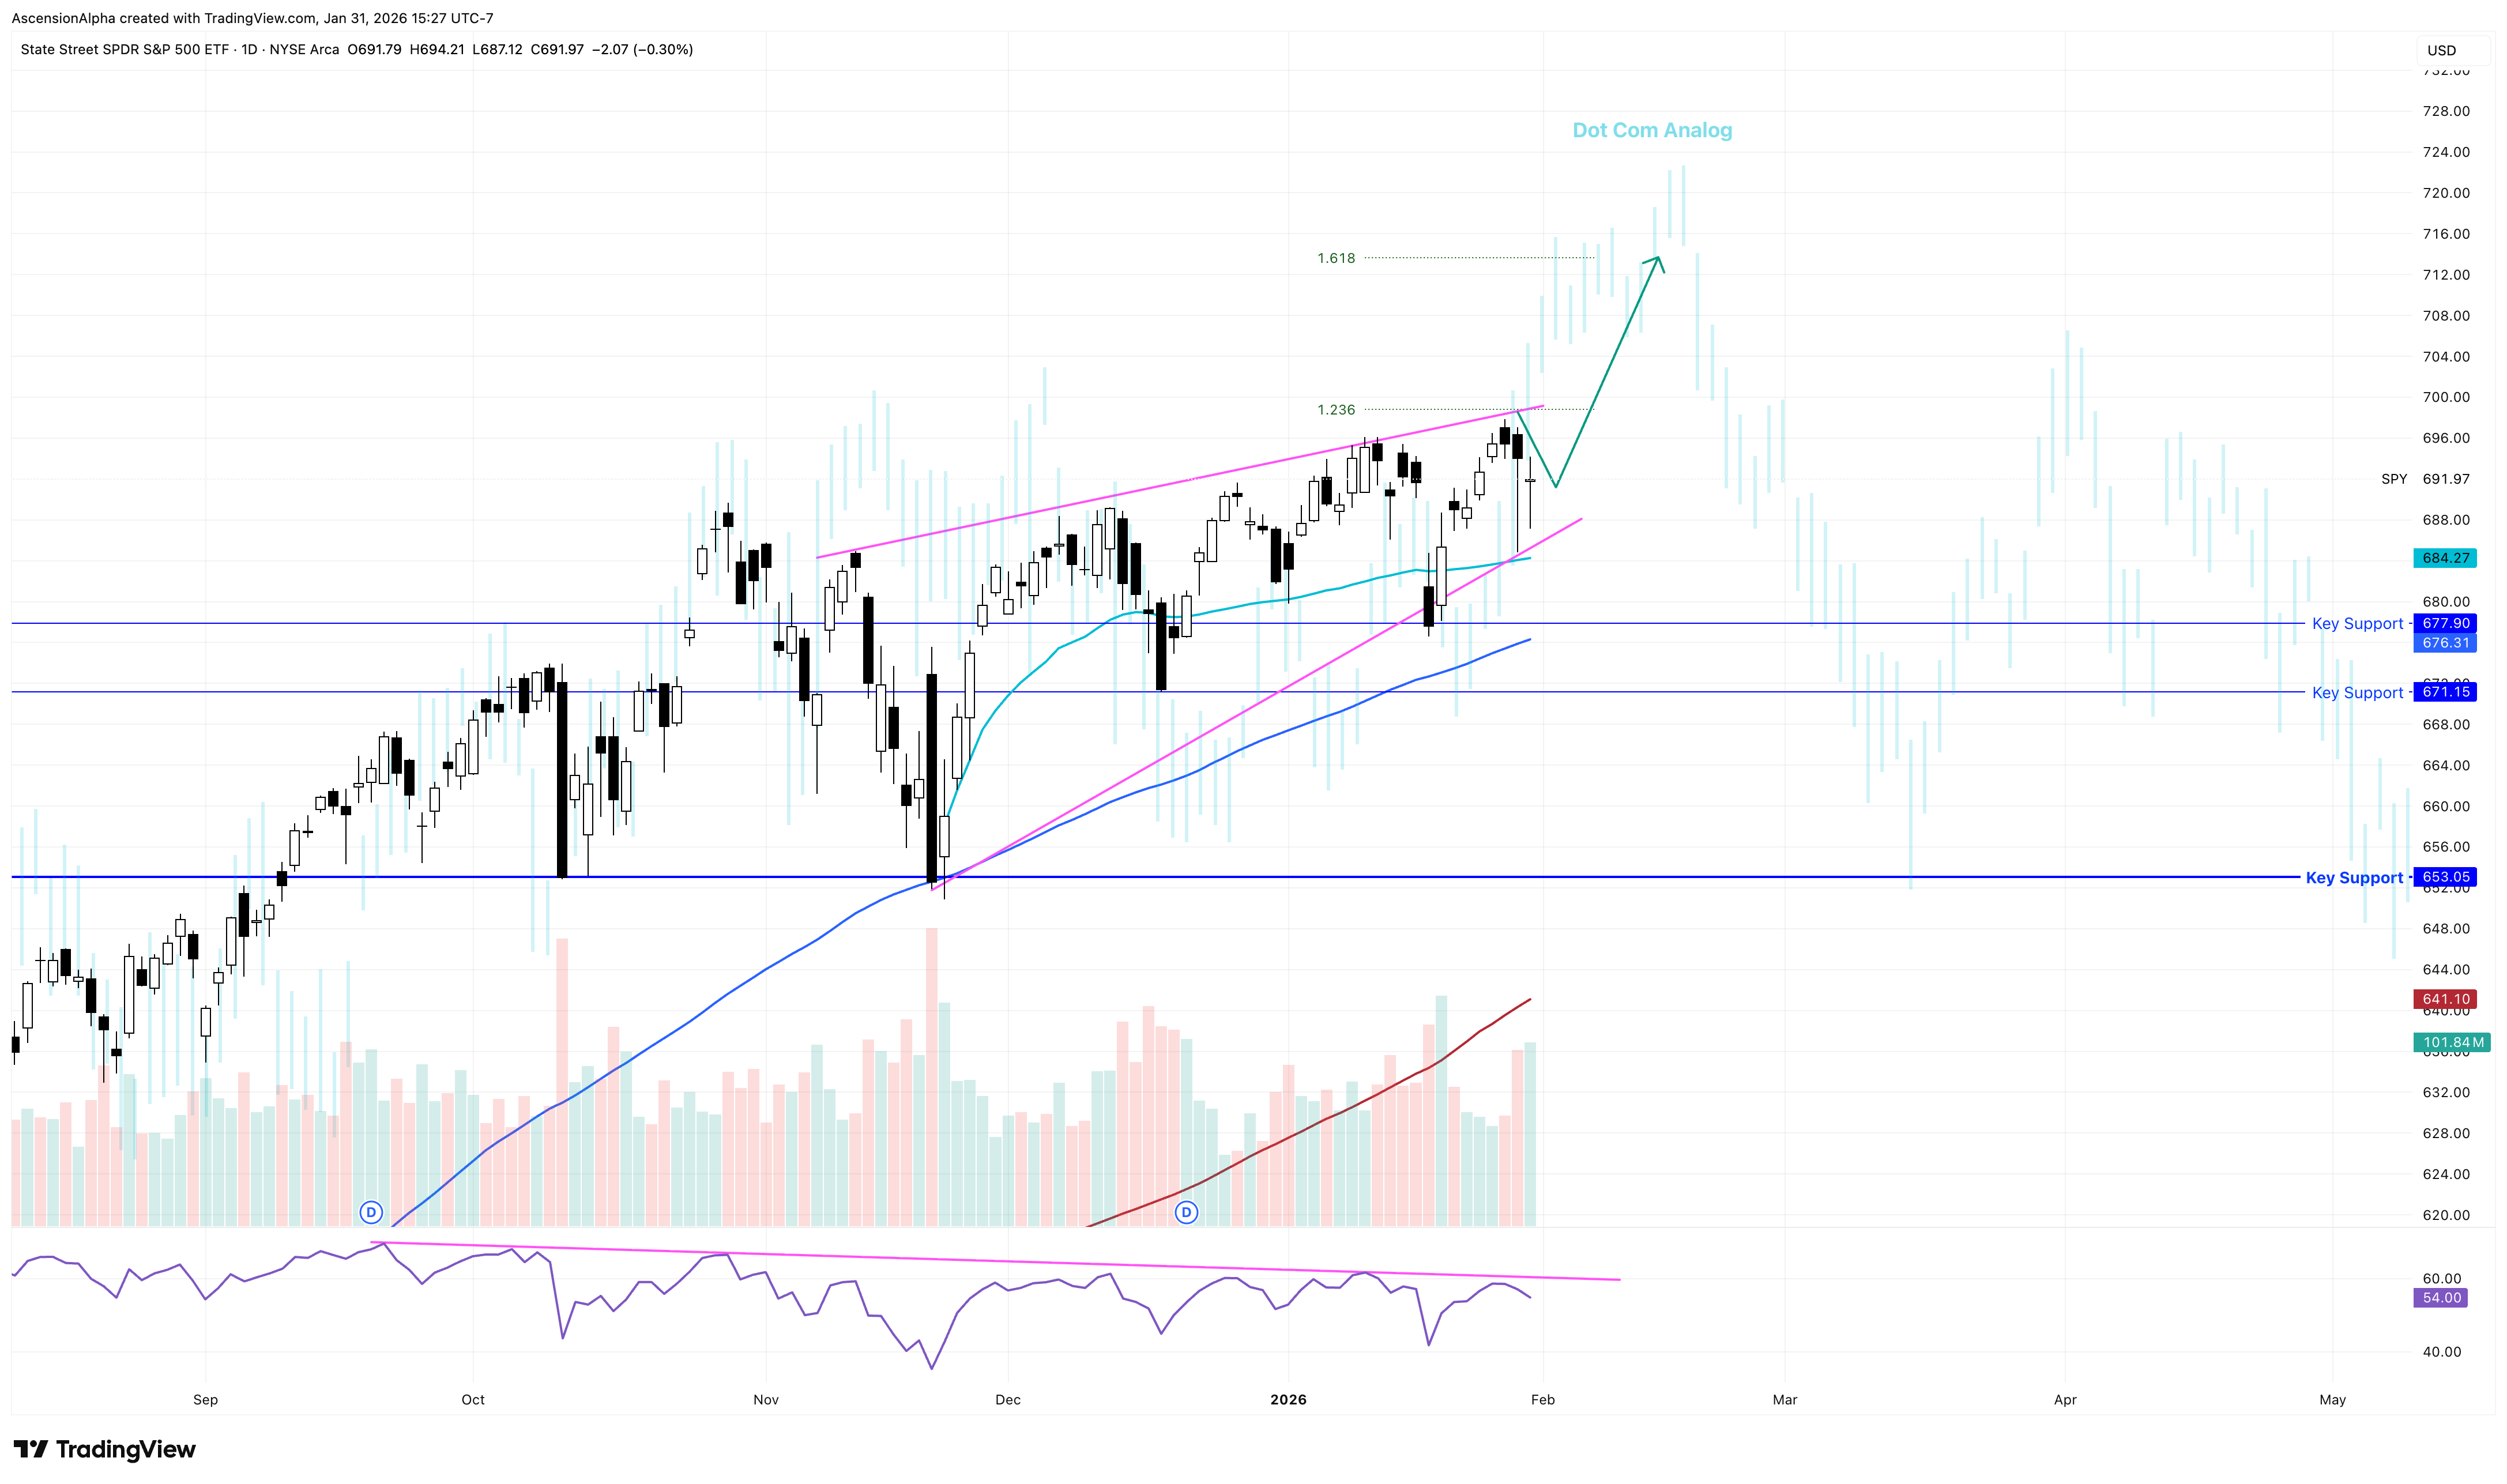
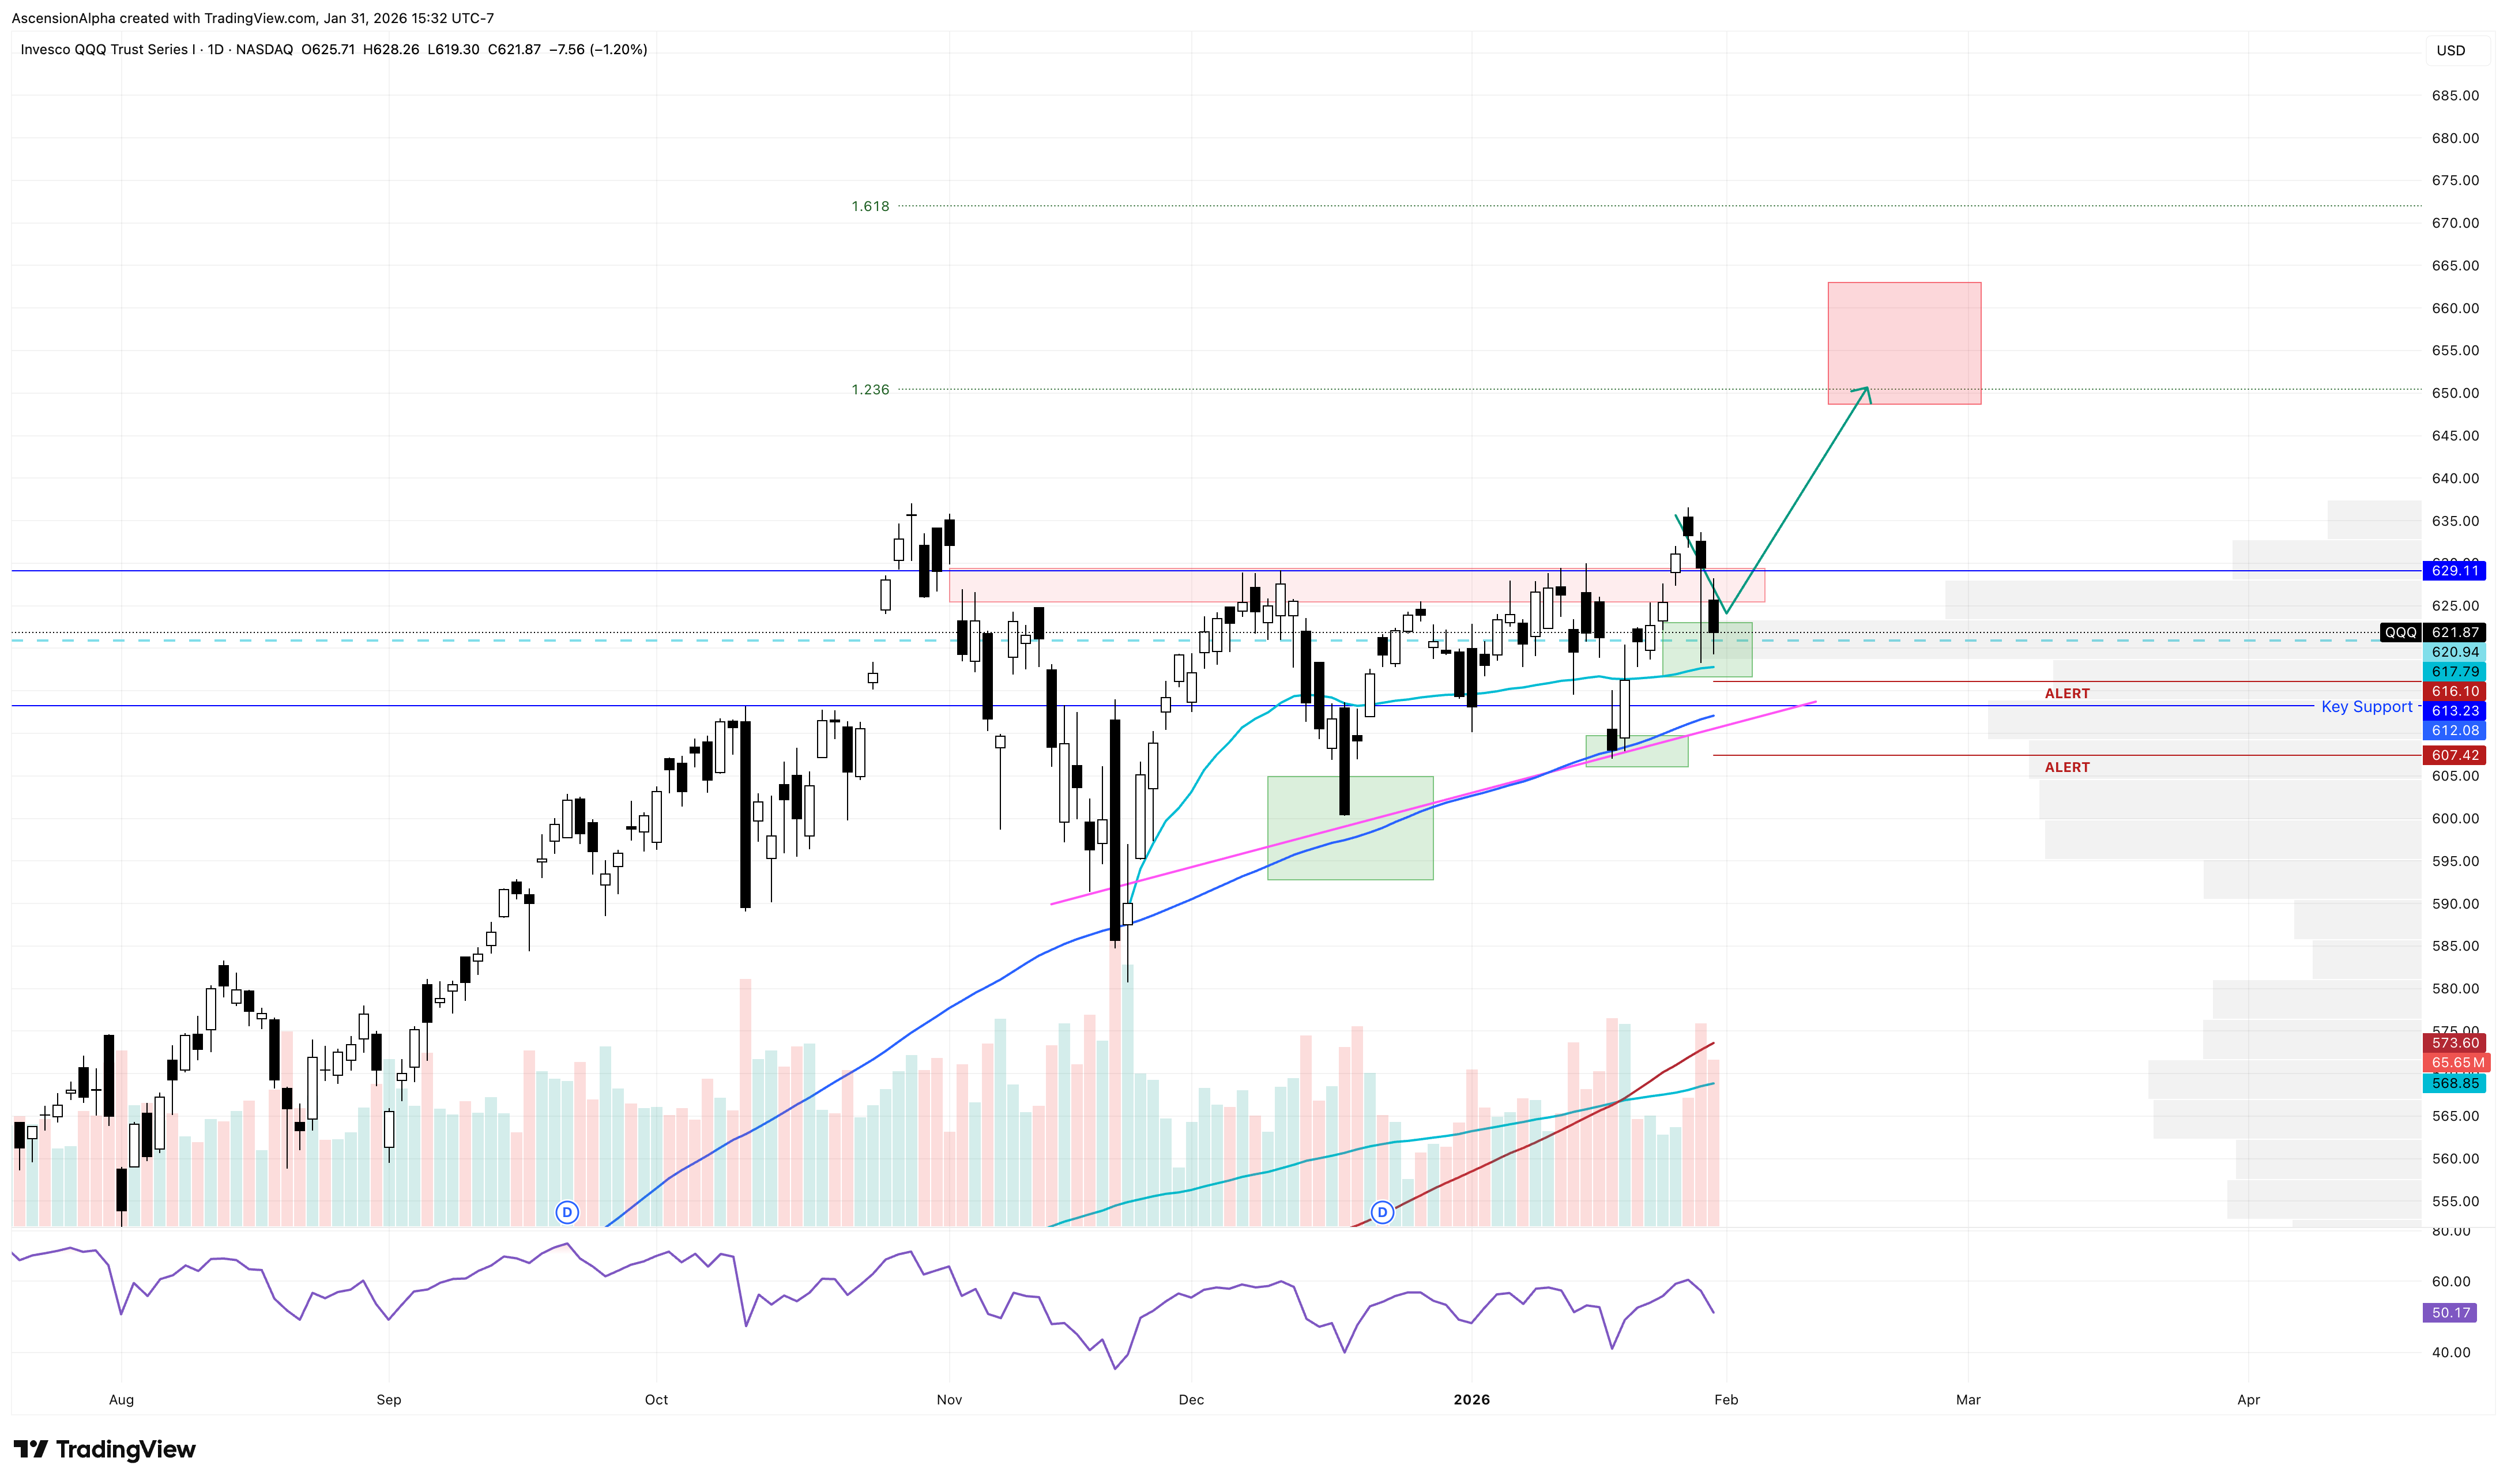
That said—and I always want to be clear here—until SPY and QQQ break below their 100-day SMAs, the trend remains bullish. There’s no reason to get overly defensive or obsessed with calling tops. In fact, the next pullback will likely be a solid buying opportunity as excess froth is worked off and some of these names that went straight up for too long finally return to more attractive levels.
QQQ Daily Chart
On the topic of corrections, we all know BTC has been in a bear market for several months now—and hopefully, if you have been following my posts, you weren’t caught off guard by that. As I write this, BTC is selling off directly into the levels we outlined last week, specifically Michael Saylor’s average price near $76,000. Once BTC broke the 100-week SMA, a move to that level became highly likely.
I still want to see BTC break below $74,000—and it may have already done so by the time you’re reading this. The $74,000–$69,000 range remains an attractive zone for a meaningful bounce.
While I was at a three-year-old’s birthday party—talking to someone about Bitcoin, because of course I was—I got an alert that weekly RSI had hit 33. The three-year-old I was giving the entire bitcoin bull thesis too wasn’t particularly excited at that alert, but I was. That level is very close to the key weekly RSI threshold that often signals a developing low. While 30 is the more textbook level, I like to start paying close attention when we get near it, and 33 is where my first alert sits. My next alert is at 30, and if we hit it, that will trigger a buy signal for me.
Historically, BTC bear-market lows tend to coincide with price interacting with the 200-week SMA, which currently sits near $58,000. I think it’s unlikely we head straight there. A more probable path is a corrective bounce first, followed by a final drop—potentially on bullish RSI divergence—to that level. That would be the ultimate long-term buying opportunity in my view.
That said, it may not play out perfectly, which is why I’m comfortable buying near the low of a long, extended A-wave, which is where we are now. It’s always possible we don’t get a clean B and C wave, or that the C wave doesn’t actually undercut the A wave in some kind of running flat correction. Either way, the risk-reward at the outlined BTC levels is attractive.
If I could script the perfect BTC setup, we’d wick down into $69,000 next week, hit 30 on weekly RSI for a high-confluence buy signal, then bounce over the next one to two months to retest the 120-SMA on the 3-day chart. That would be followed by a final C wave breakdown to a new low near the 200-week SMA on bullish RSI divergence. If that happens—which it won’t, because BTC never wants to make things that easy—I’ll have my trading year made.
BTC Daily Chart