
Bulls vs Bears
Market Milestones

SPY finds itself back in the chop, sending mixed signals as we head into the weekend. There are signs that further weakness could develop, yet price continues to hold firm at key support levels. This is one of those moments where both sides of the tape deserve respect. Let’s walk through the bull case and the bear case as things stand right now.
BULL CASE
The biggest argument for the bulls is simple: support is holding.
Yes, SPY briefly broke a very minor support level on Monday, but that level was reclaimed after a single session. When any support — whether it’s a moving average, anchored VWAP, horizontal level, or trendline — breaks and is regained within two to three days, I generally treat that move as market makers running stops rather than a true structural breakdown. In those cases, I don’t count it as a meaningful break.
That said, a clean break below $677 would be much more material. This level has been reinforced by the most recent pivot and now stands out as a key line in the sand. Lose it decisively, and the tone changes.
For now, SPY is also still holding the 100-day SMA. As long as price remains above the 100-day, the risk of a larger selloff remains relatively low. Once SPY closes below the 100-day and fails to reclaim it quickly, the odds of a deeper move toward the 200-day — or worse — rise dramatically.
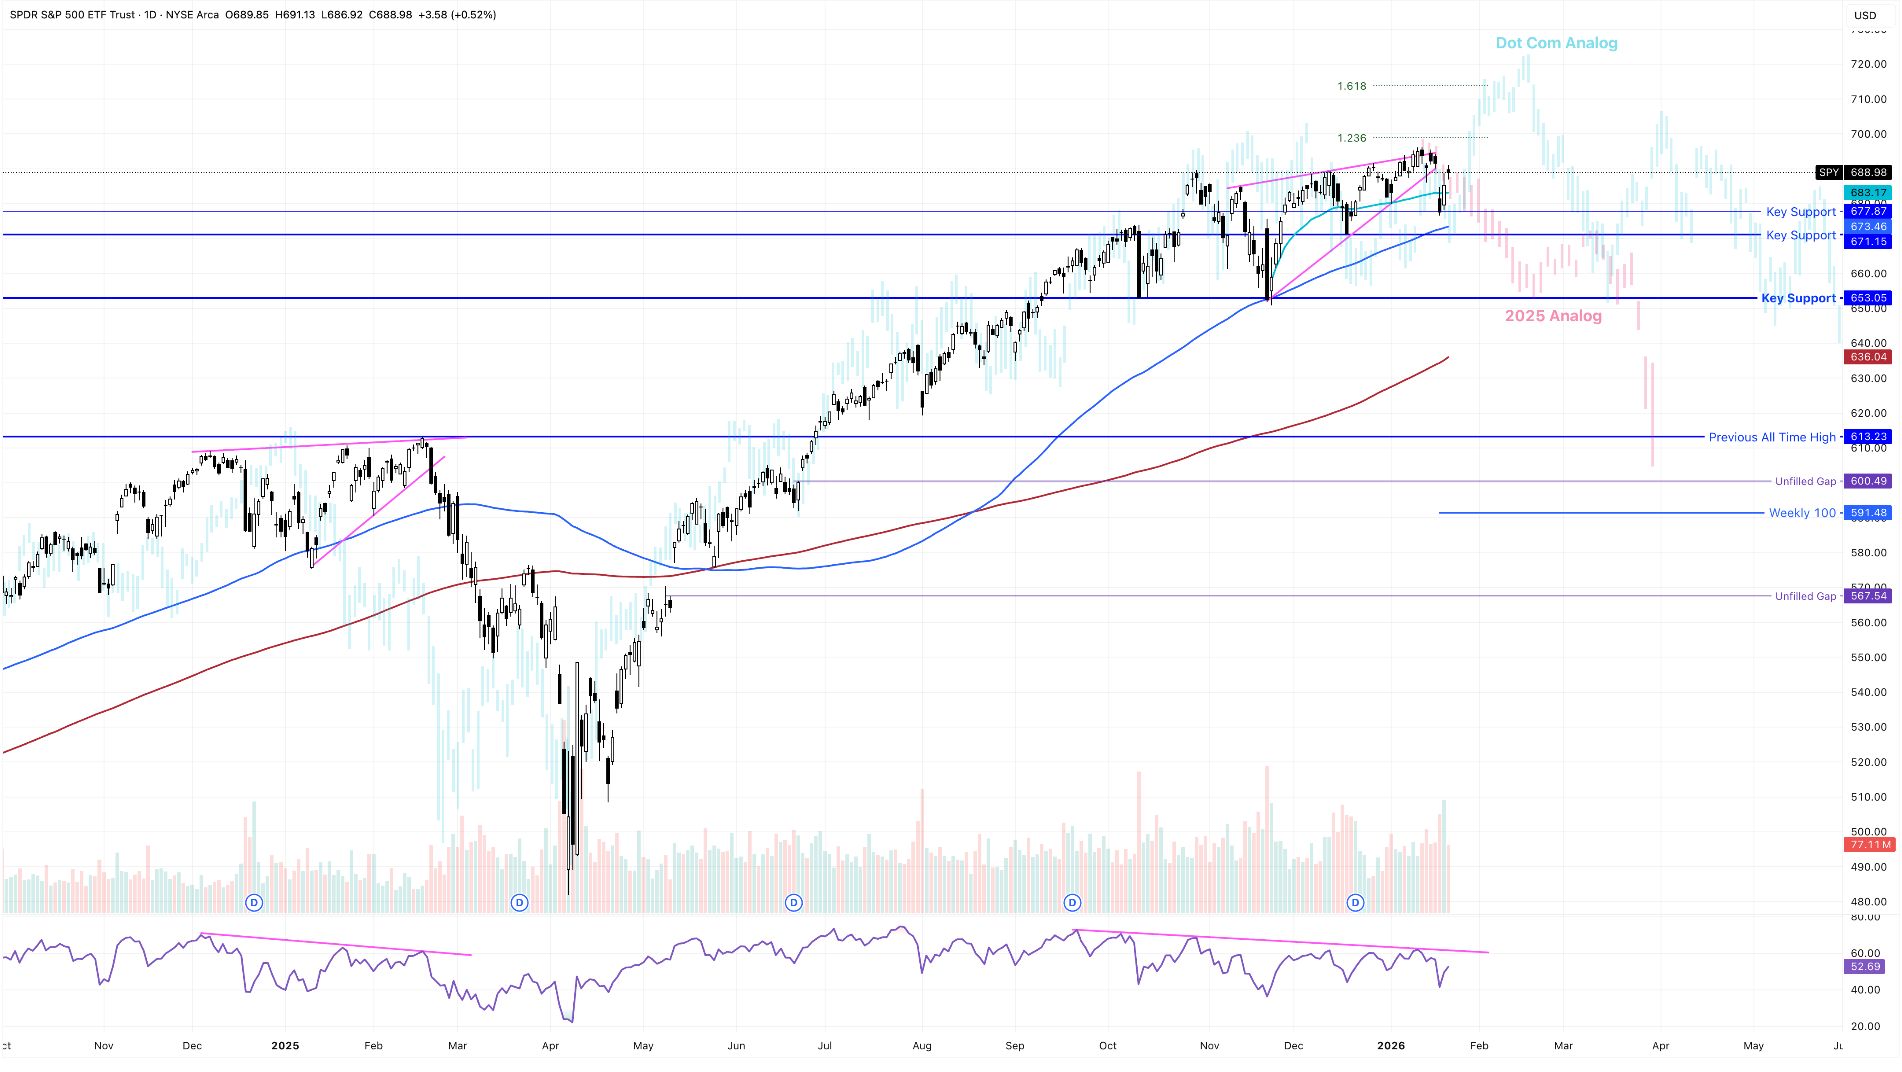
In the dot-com analog we’ve been tracking, represented by the blue bars, the market held its 100-day SMA all the way through the blow-off move in July of 1999. That top lines up well with a potential February window this cycle. If that pattern continues to play out, we should continue making higher lows, hold the 100-day SMA, and see a push toward the $710 area before a more meaningful correction takes hold.
SPY Daily Chart with Dot Com & 2025 Analog
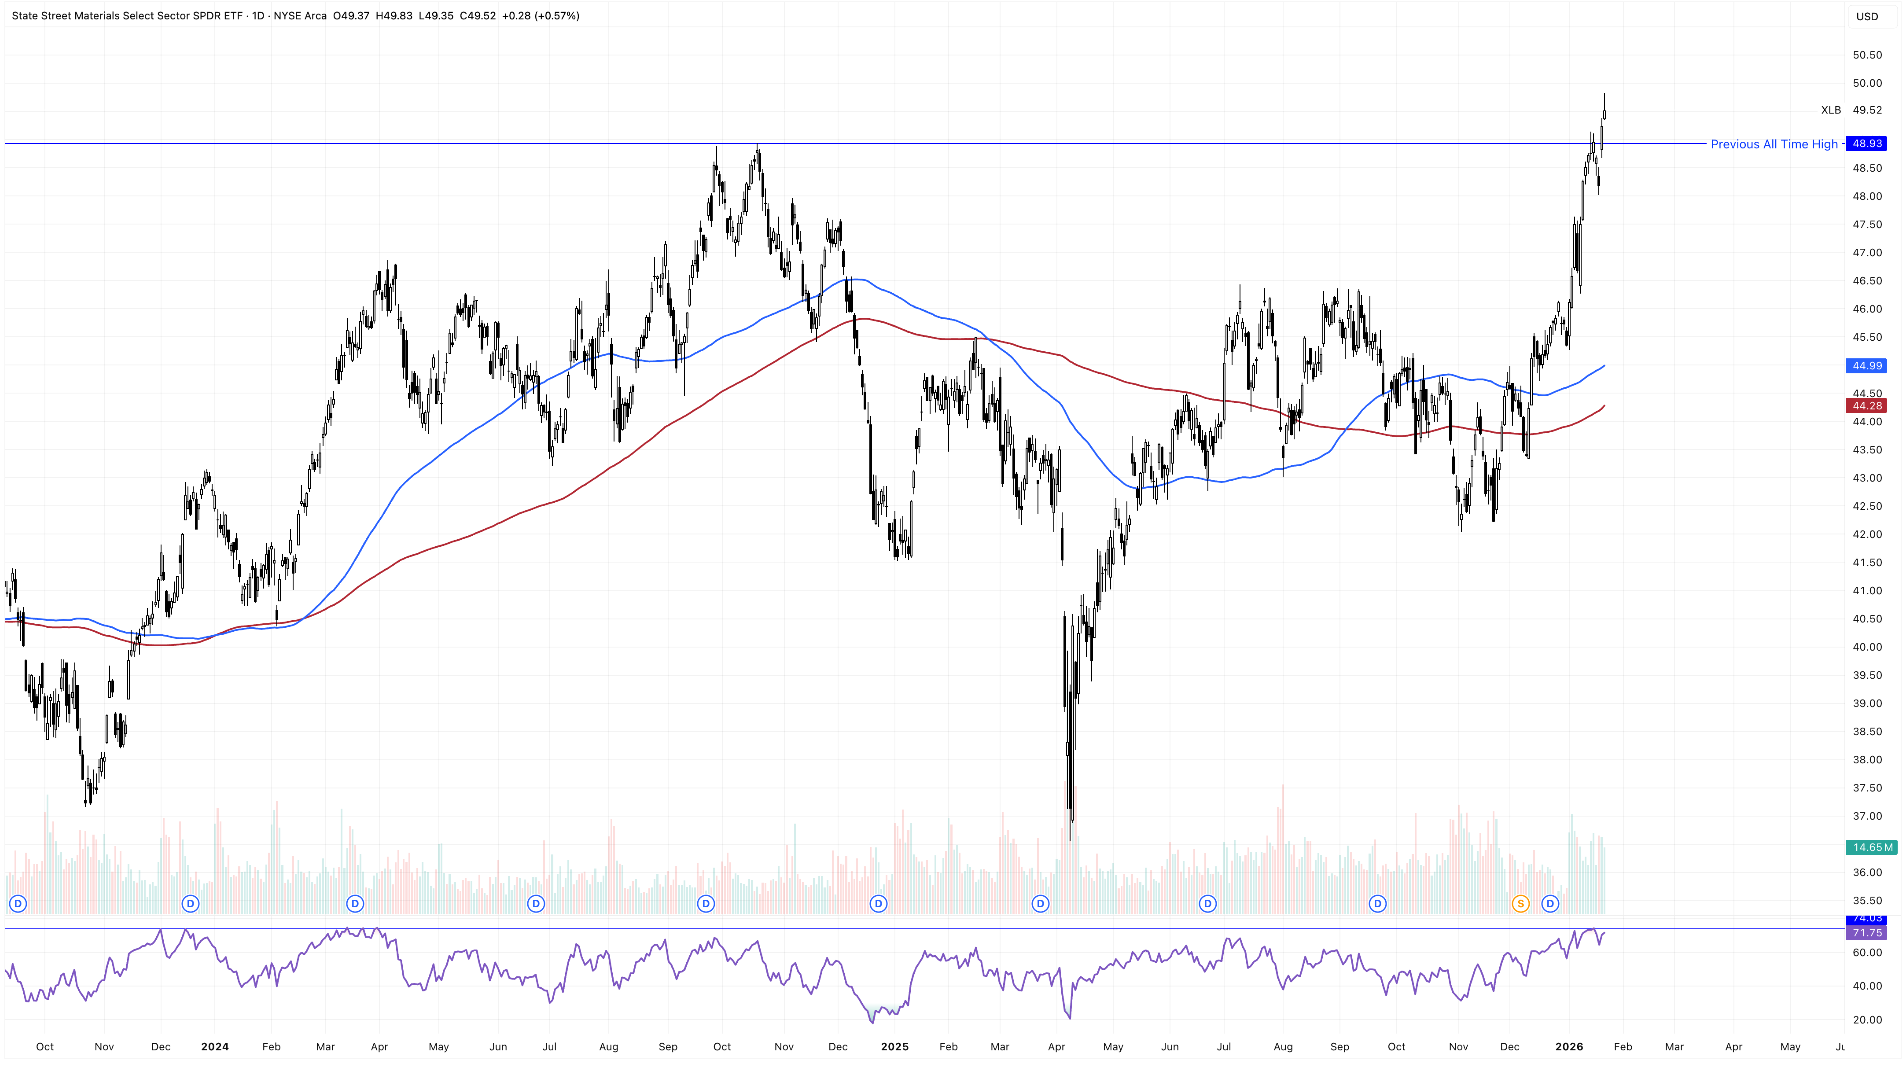
Another bullish talking point is the broadening out of the market. We’re seeing strength across RSP (equal-weight S&P 500), IWM (small caps), SMH (semiconductors), IYT (transports), XLB (materials), XLI (industrials), XLE (energy), XLP (consumer staples), and KRE (regional banks).
This is positive on the surface, but it’s a double-edged sword. Without participation from the Trillion Dollar Titans, the market’s upside is ultimately limited. Those mega-cap tech names are simply too large to ignore. While it’s encouraging to see other sectors pushing higher, many of them are starting to look extended and potentially nearing their own peaks. For now, this factor sits in the neutral camp: bullish today, but it must be sustained and supported by big tech to truly matter.
XLB Daily Chart
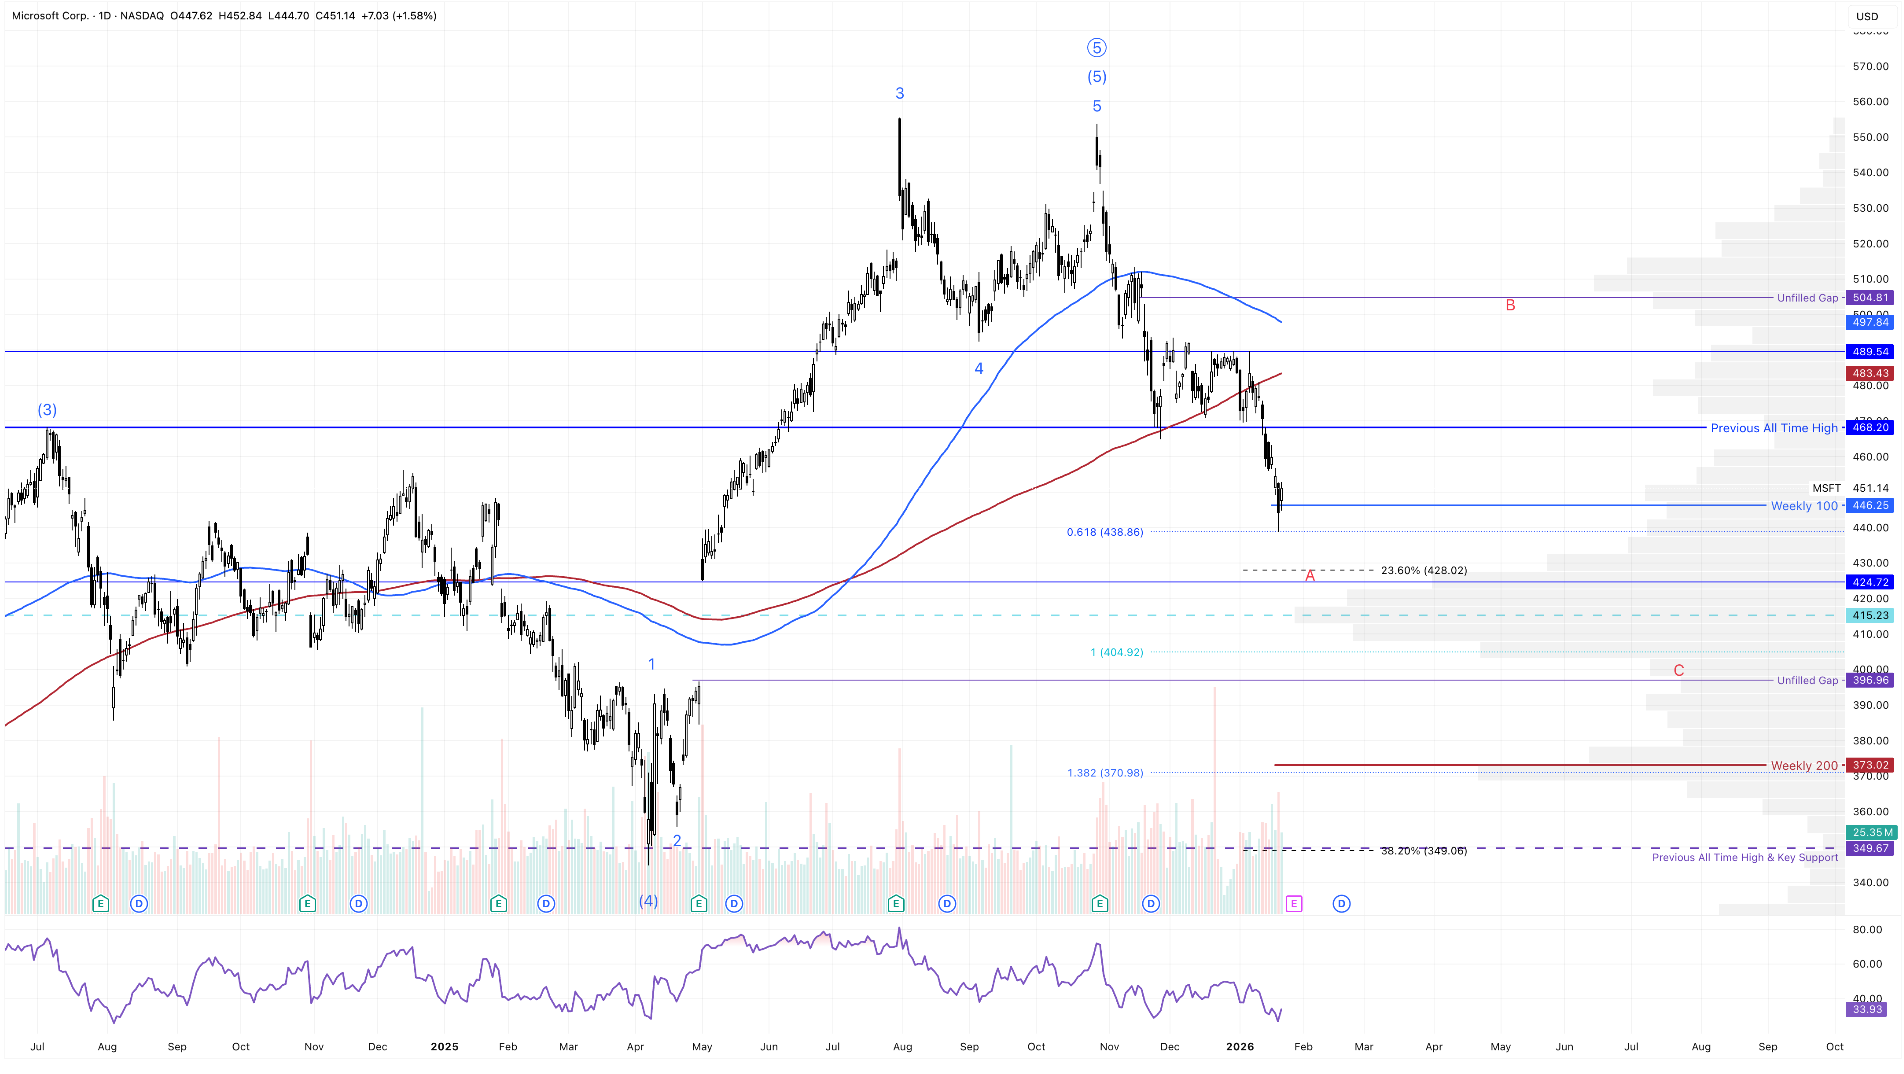
Speaking of big tech, many of the key names have already sold off significantly and are now sitting at major support levels. That divergence will show up again in the bear case, but in the short term it actually provides some bullish fuel. These beaten-down leaders are ripe for a bounce, and even a short-lived rebound lasting four to eight weeks could be enough to buoy the broader market.
That “temporary everything bullish” scenario fits well with the blue-bars dot-com analog, where price pushes higher one more time before rolling over into a deeper correction.
MSFT Daily Chart
BEAR CASE
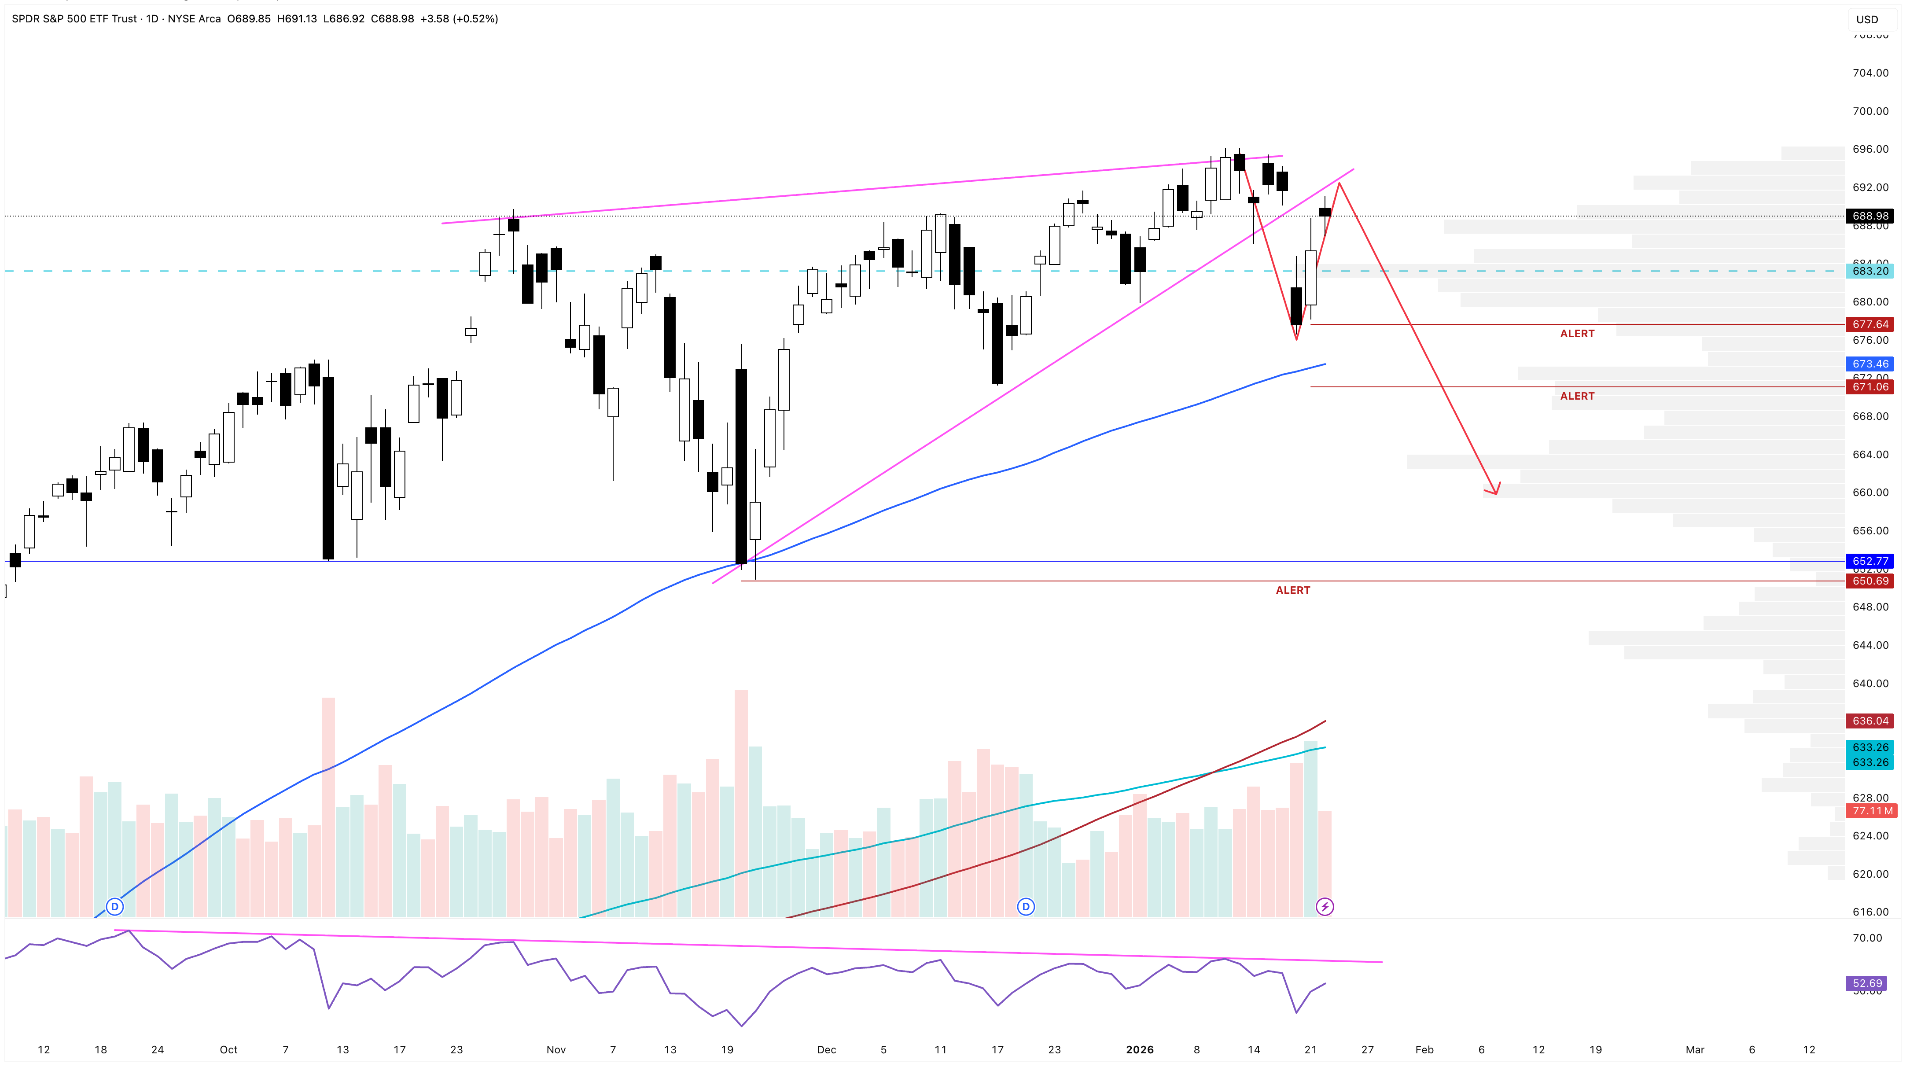
Tuesday’s gap was anything but bullish.
The chart had been warning of a potential breakdown, and Tuesday delivered. SPY has been tracing out a rising wedge, or ending diagonal, since early November, complete with waning momentum and clear RSI divergence. At the same time, QQQ has failed to make a new all-time high, with persistent selling pressure near the $630 area shutting down every breakout attempt.
The rally off Tuesday’s low looks more like a retest of the bearish gap than the start of a new impulsive leg higher. As long as Tuesday’s low holds, there’s no immediate cause for alarm. But if that low breaks, it would be a major warning sign and a textbook resolution of the rising wedge pattern.
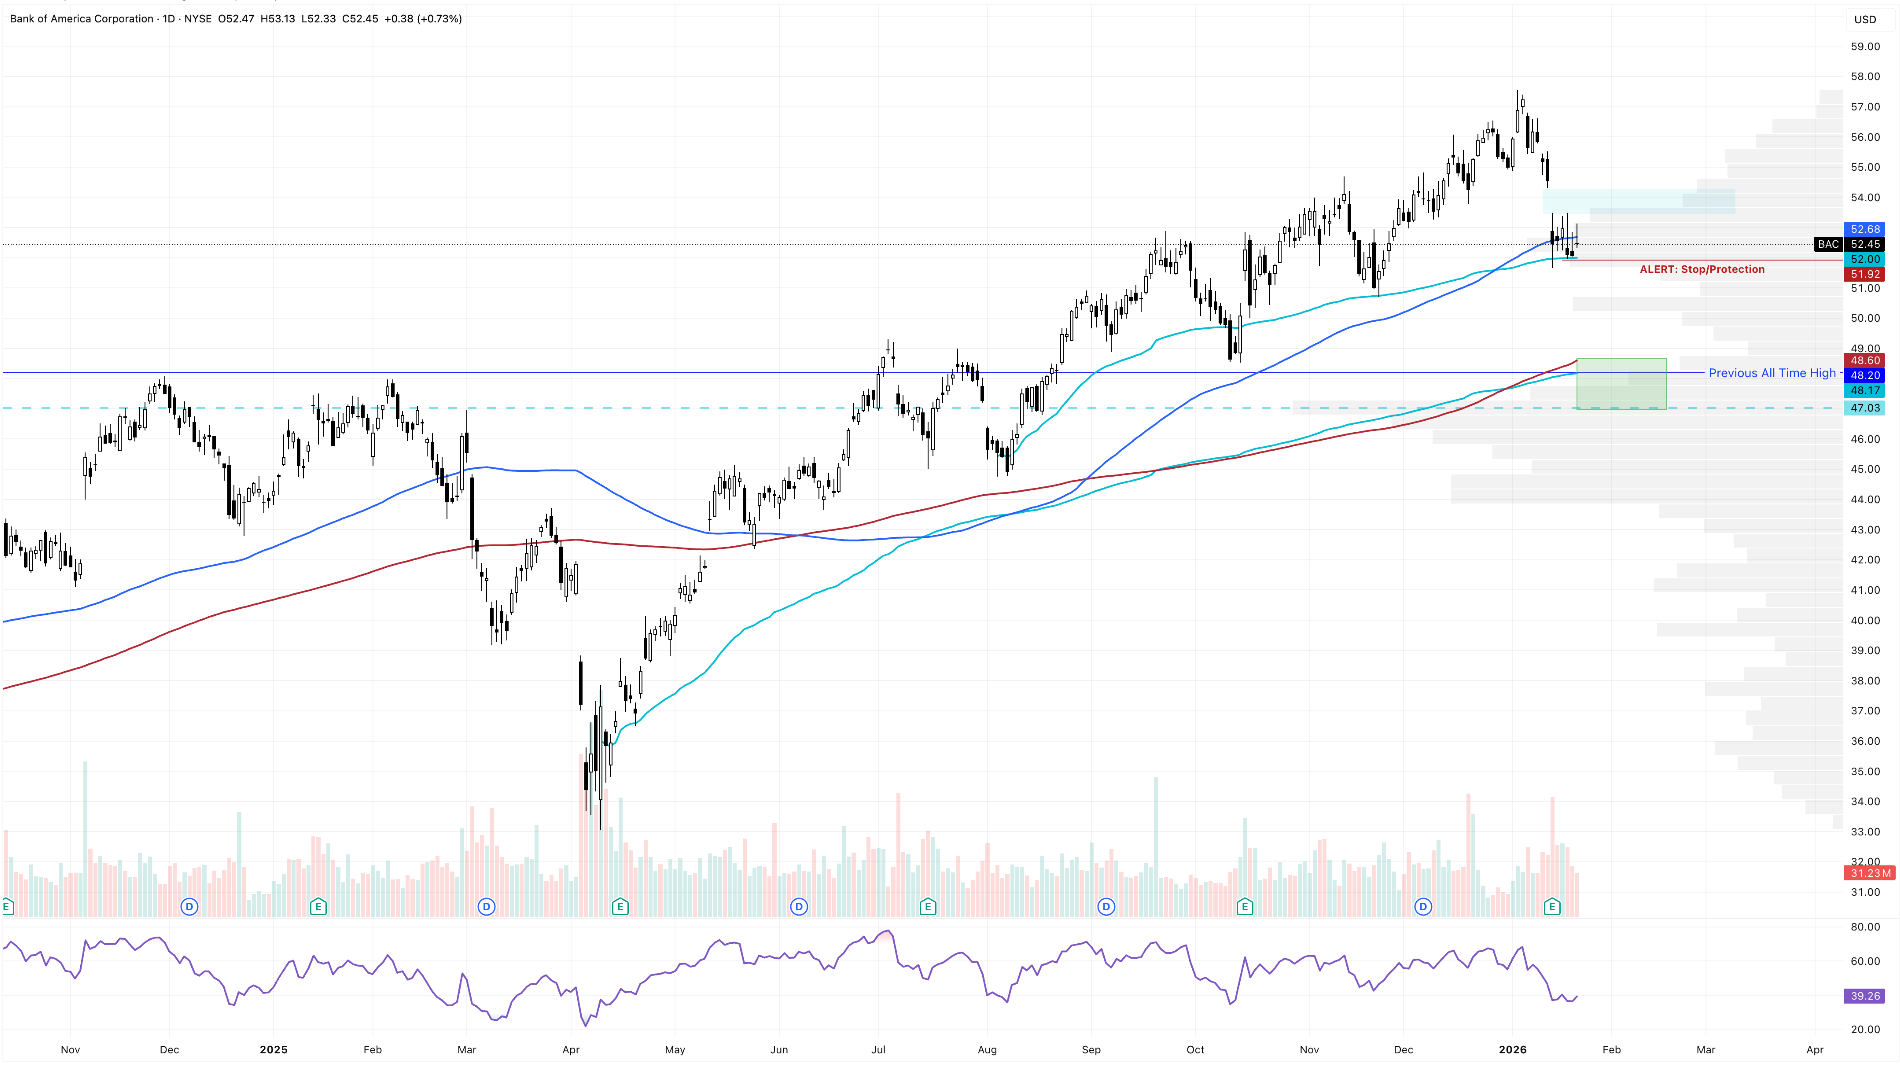
Banks are another concern. They were a major driver of SPY’s outperformance over the past few months, especially during the December surge. Since then, many bank stocks have broken down and lost key support levels. Goldman Sachs remains strong and continues to push higher, but even Morgan Stanley is flirting with a potential breakdown and pullback. Without banks and big tech participating together, SPY will struggle to make meaningful progress higher.
BAC Daily Chart
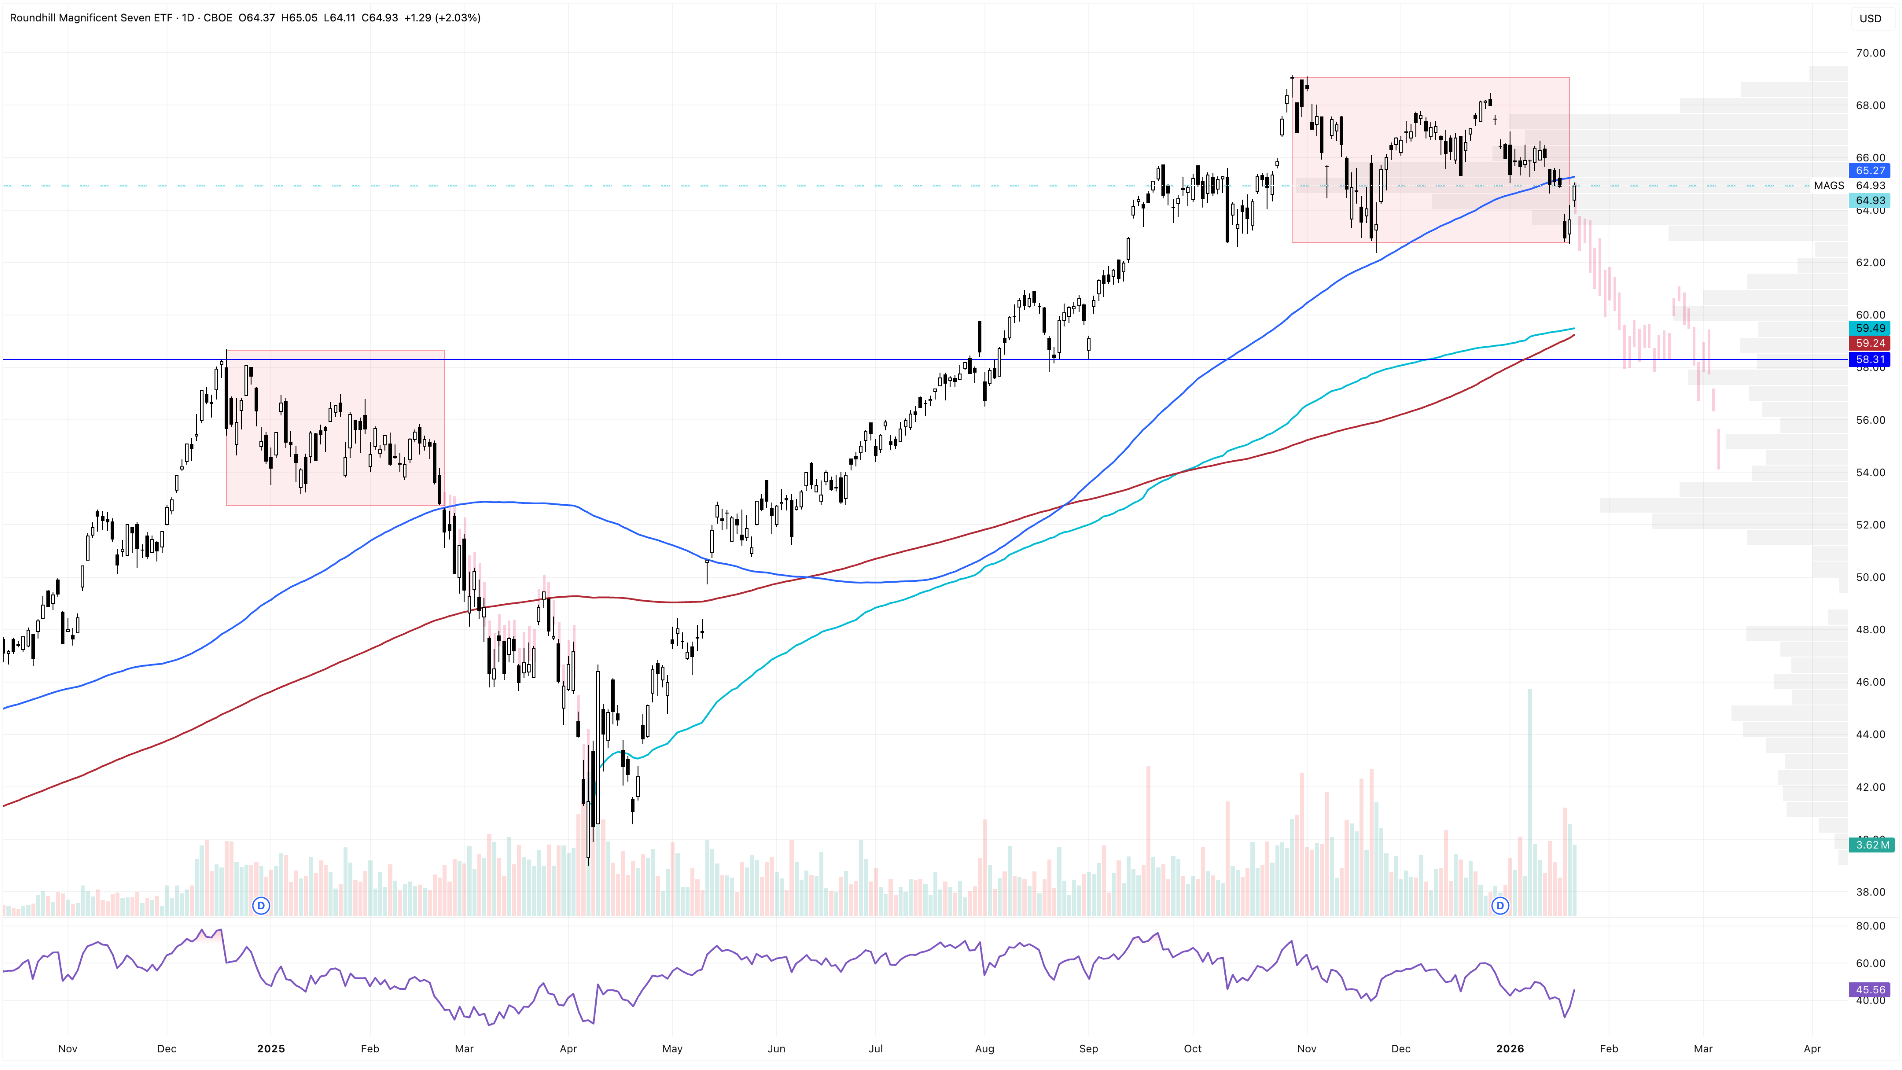
Finally, the Trillion Dollar Titans remain a glaring issue. The Mag 7 ETF (MAGS) topped on October 29th, right alongside QQQ, and has been under pressure ever since. The last time we saw a divergence this large between SPY and the mega-cap leaders was during the December 2024 to February 2025 period.
That historical parallel adds weight to the red-bars scenario. The similarities in SPY’s price action are striking, and seeing the same type of divergence in the largest stocks on the planet is not something to dismiss.
MAGS Daily Chart
The actionable takeaway from all of this can be distilled into just a few key points.
As long as SPY continues to hold its 100-day SMA, there is no real reason to get overly worried yet. That level remains the major line in the sand. A clean break and failure to reclaim the 100-day is where caution turns into active hedging.
On the tech side, unless QQQ can reclaim and hold above $630, the most likely outcomes are continued sideways chop or a breakdown toward (and potentially below) its own 100-day SMA.
I do expect a more substantial correction at some point this year, and I plan to use that as a buying opportunity. The only real question is timing — whether that correction arrives now or later. Until that becomes clear, my approach remains the same: quicker exits, more aggressive risk mitigation, and an overall more cautious posture.