
The Last Bounce
What History Tells Us Happens Next


Fear is finally creeping into the market as uncertainty builds and major indexes start losing critical levels. On Friday, SPY closed below Monday’s candle, exactly as Jeremy and I flagged in Tuesday’s Top Trades video and newsletter. DIA and RSP did the same, leaving their charts looking particularly ugly.
Not everything broke down, though. QQQ and IWM are clinging on (barely), while SMH is displaying solid relative strength, driven largely by MU, which right now feels like the strongest stock on the planet. That said, if NVDA and TSM (which together account for roughly 30% of SMH’s holdings) start cracking, that outperformance could vanish in a flash.
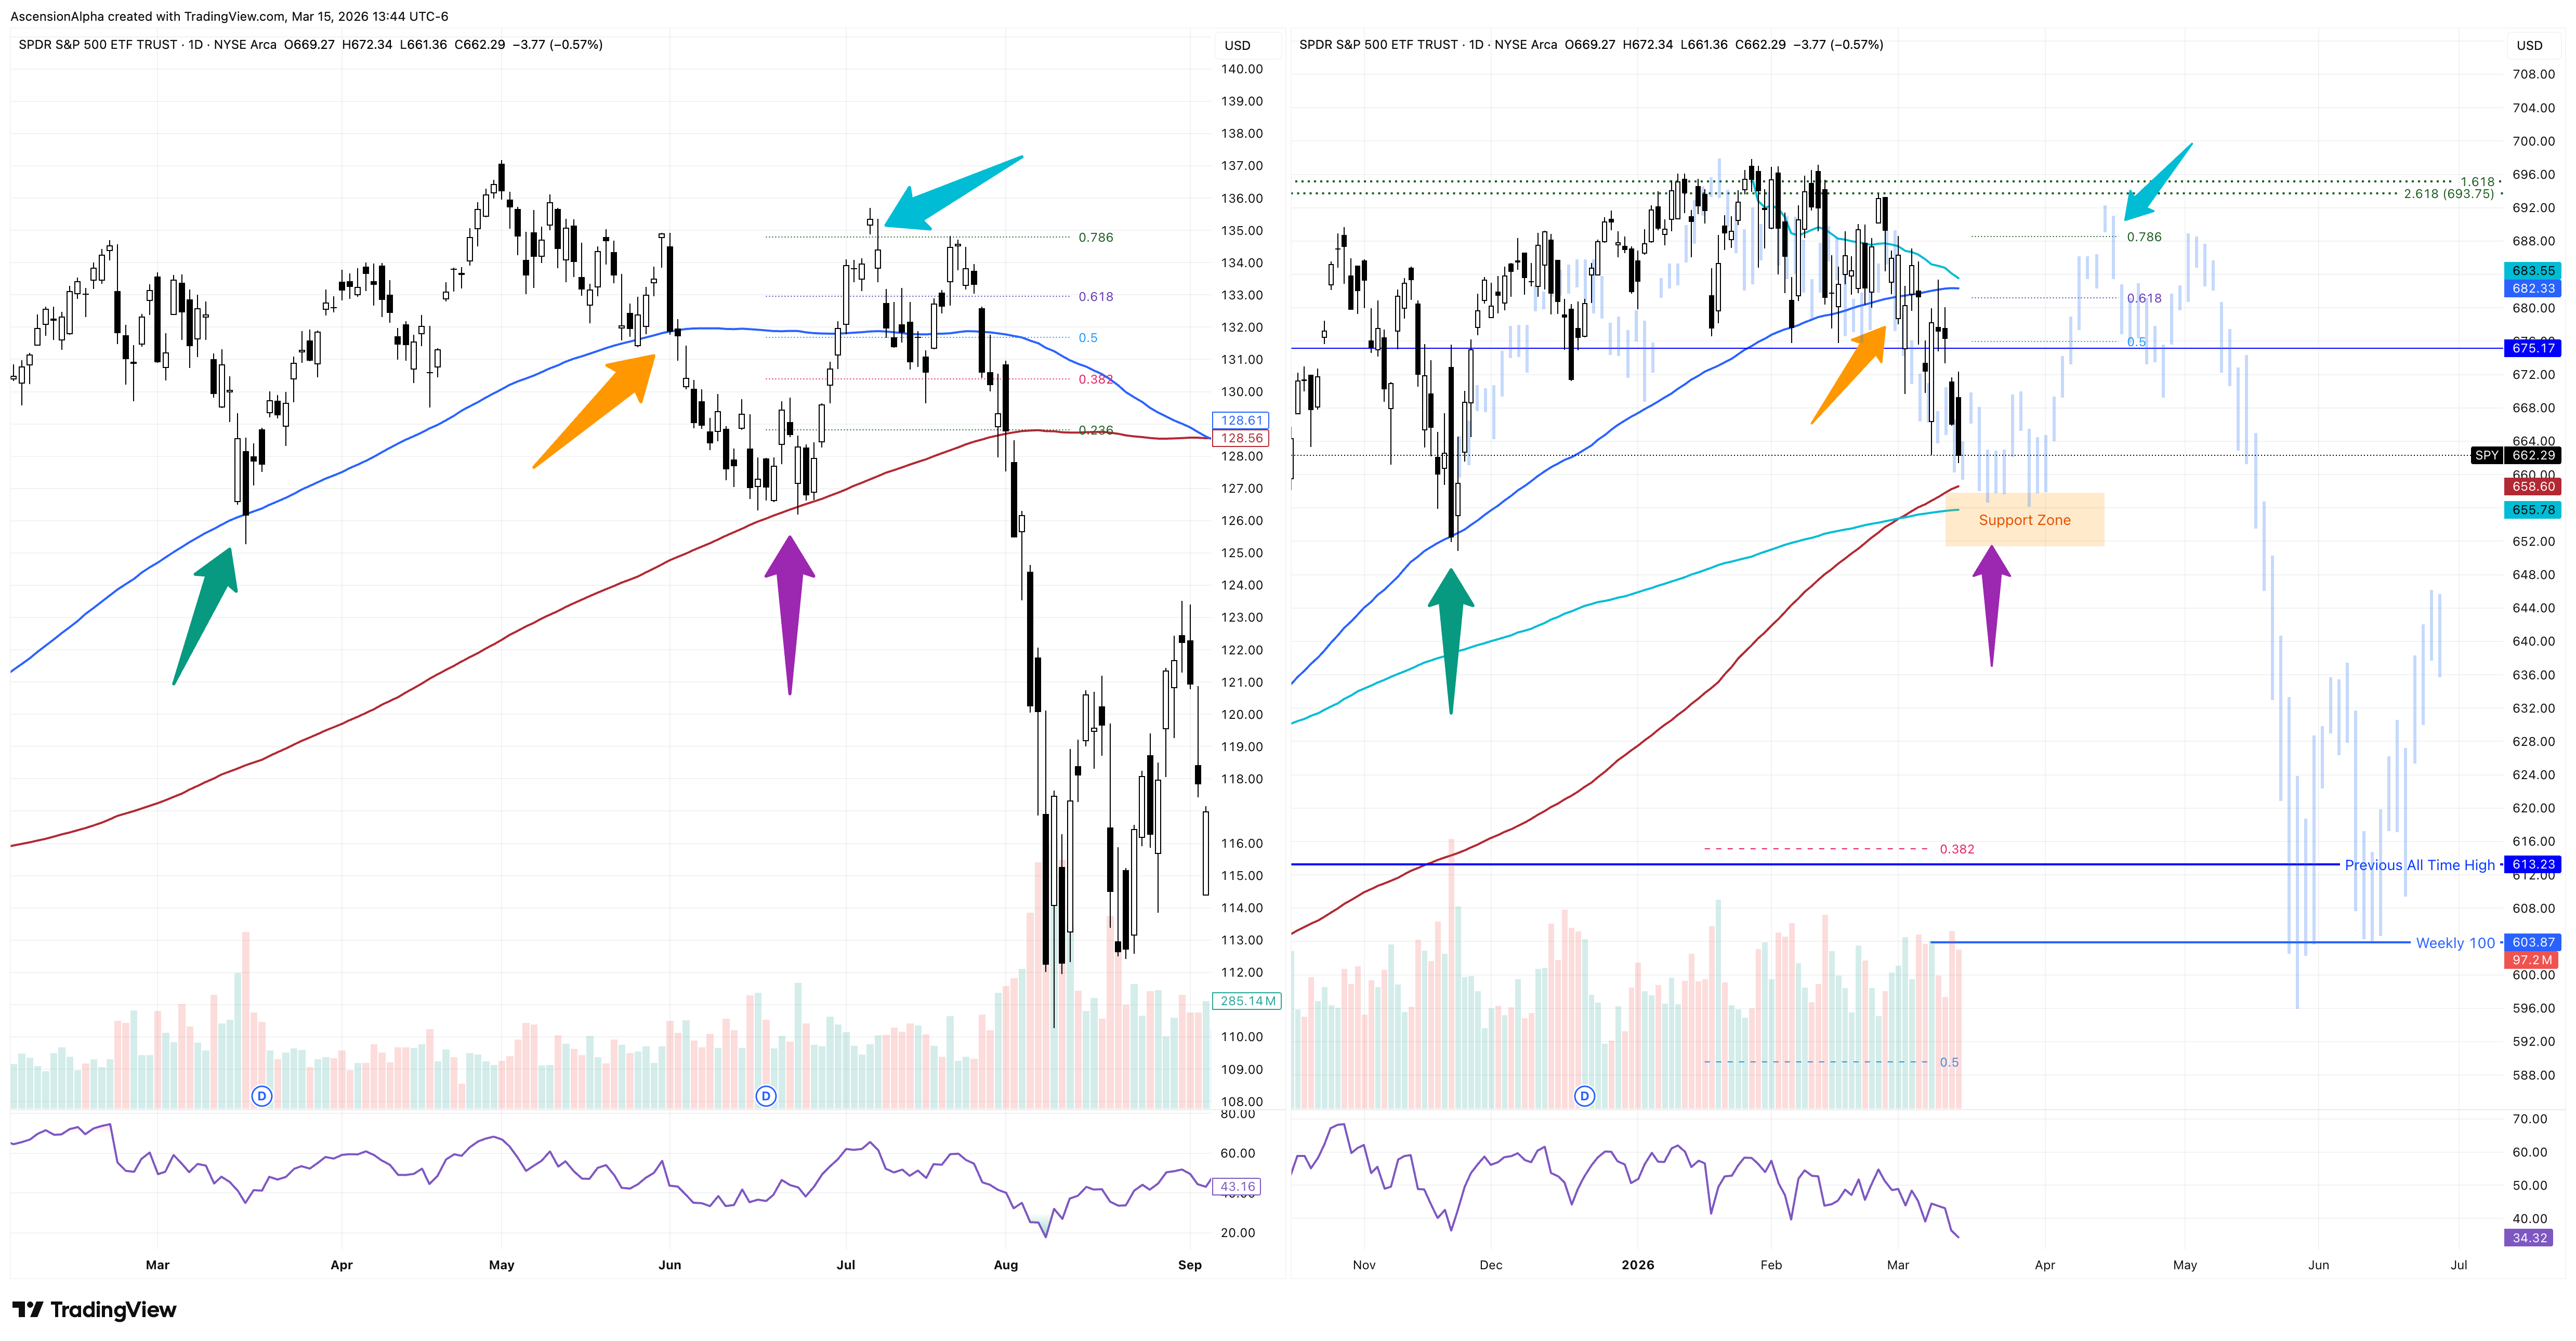
While I have been warning about caution for all of 2026 based on the chart patterns unfolding, it finally feels like that fear is starting to permeate the market. Ironically, with so many traders hedged and nervous about a drop, the setup screams for a classic B wave bounce soon. I’d still prefer a bit more downside before the bounce: an RSI dip on SPY to around 31 (a level that has reliably triggered bounces) would be perfect. That would also drag SPY into a strong support zone between $659 and $650, where the 200-day SMA and the anchored VWAP from the May 12 breakaway gap currently live.
SPY Daily Chart

Historical Parallels Are Stacking Up
I spent hours this weekend poring over SPY and SPX charts, reviewing prior drops, divergences, and every bear market back to 1929. As I laid out in my February 19 article, “The Deadly Flatline,” the 2011 and 2015 consolidations still align spookily well with our current structure.
A month later even more parallels jump out. In 2015, the market chopped sideways for months, clinging to the 100-day SMA until it finally gave way. The slide from the 100-day break to the 200-day SMA took just one day, but the 200-day held, sparking a bounce into a lower high (back above the 100-day and just past the 78.6% retracement) before the real carnage unfolded in a vicious C wave that caught many off guard.
2015 Daily Chart Analog

2011 showed almost the identical playbook: after a blistering run, SPY kissed the 100-day SMA once then rocketed to new highs (mirroring our November & December move). A few months later it touched the 100-day again, struggled to go higher, and broke it decisively. It flushed quickly to the 200-day (which held perfectly), bounced to a lower high near the 78.6% retracement and just above the 100-day SMA, then plunged lower in a sharp C wave vertical drop.
2011 Daily Chart Analog
A Fresh (and Eerily Similar) Analog: 1966
During my market study this weekend, I also found another analog that I like for this move. As you know, I had been closely watching the dot-com analog for some time because there are only a few periods in history where markets have moved as bullishly as they did in 2025, and the late 1990s was one of them. However, if we were still tracking that pattern, we should have seen a strong blow-off move to new highs that hit all targets and sucked in breakout buyers before this most recent drop. Since that did not occur, I am no longer tracking that pattern for now.
Instead, the 1962-1966 market is showing remarkable similarities. The 2022 bear market bottomed in October, just like the 1962 double bottom. Both saw powerful rallies to new all-time highs over roughly 450 days. The first major pullback hit ~2.5 years after those October lows. A steep drop in 1965 and 2025, followed by sharp recoveries to new highs, both in about 80 days.
The alignment gets even crazier from there. On March 3, 2026, SPY decisively broke the 100-day SMA. The equivalent break in 1966 occurred on February 21, just nine days apart almost exactly 60 years later. From there, the 1966 market flushed lower into, and slightly below, the 200-day SMA, found support, and then bounced to the 78.6% retracement of the initial drop. It briefly reclaimed the 100-day SMA, just like we saw in 2011 and 2015, before everything unraveled into a brutal C wave that retraced roughly 50% of the entire advance off the lows over the next five months, ultimately retesting the prior cycle highs from 1962.
SPX 1966 Daily Chart

SPX 1966 Analog Bars

The 2018 Frankenstein Bars
I’ve also stitched together a new bars-pattern analog in red on my SPY chart, pulling from the 2018 correction. The February 6, 2018 candle mirrors our Monday, March 9, 2026 bull candle very well: bear candle gapping down below the 100-day SMA but not into the 200-day SMA, aggressive dip-buying on heavy volume to close with a long day bullish candle. In both cases, that bullish candle was erased and closed below within the week.
In 2018, the market hit the 200-day SMA quickly (one day after the close below that bullish candle), found support, then bounced sharply to the 78.6% retracement before rolling over. The actual 2018 chart then chopped sideways from April through October, but since we’ve already done plenty sideways chop, I cut that portion and placed the C wave directly after the B wave for my current pattern.
Yes, it’s a bit of a Frankenstein Chart Monster. But it visually captures the essence of the historical setups above.
SPY 2018 Frankenstein Analog

Bottom Line: Probabilities Still Favor a Bounce, Then Lower Lows
The parallels across these periods are striking. Of course, this time could be different. We might skip touching the 200-day before bouncing, or a fear event could gap us straight through that key average on heavy bearish volume. If that happens, I will quickly pivot.
As I have been saying all year, I think caution is absolutely warranted right now. However, based on this analysis, I do not mind trying to trade some of this fear to the upside for a month-long B wave bounce. With many individual stocks looking ready for a short-term reaction higher, and midterm-year volatility right on historical schedule, the probabilities still lean toward some kind of bullish bounce before a larger and steeper selloff materializes later this year.