
Thursday Trending Trades
RLT Newsletter 2/12/26


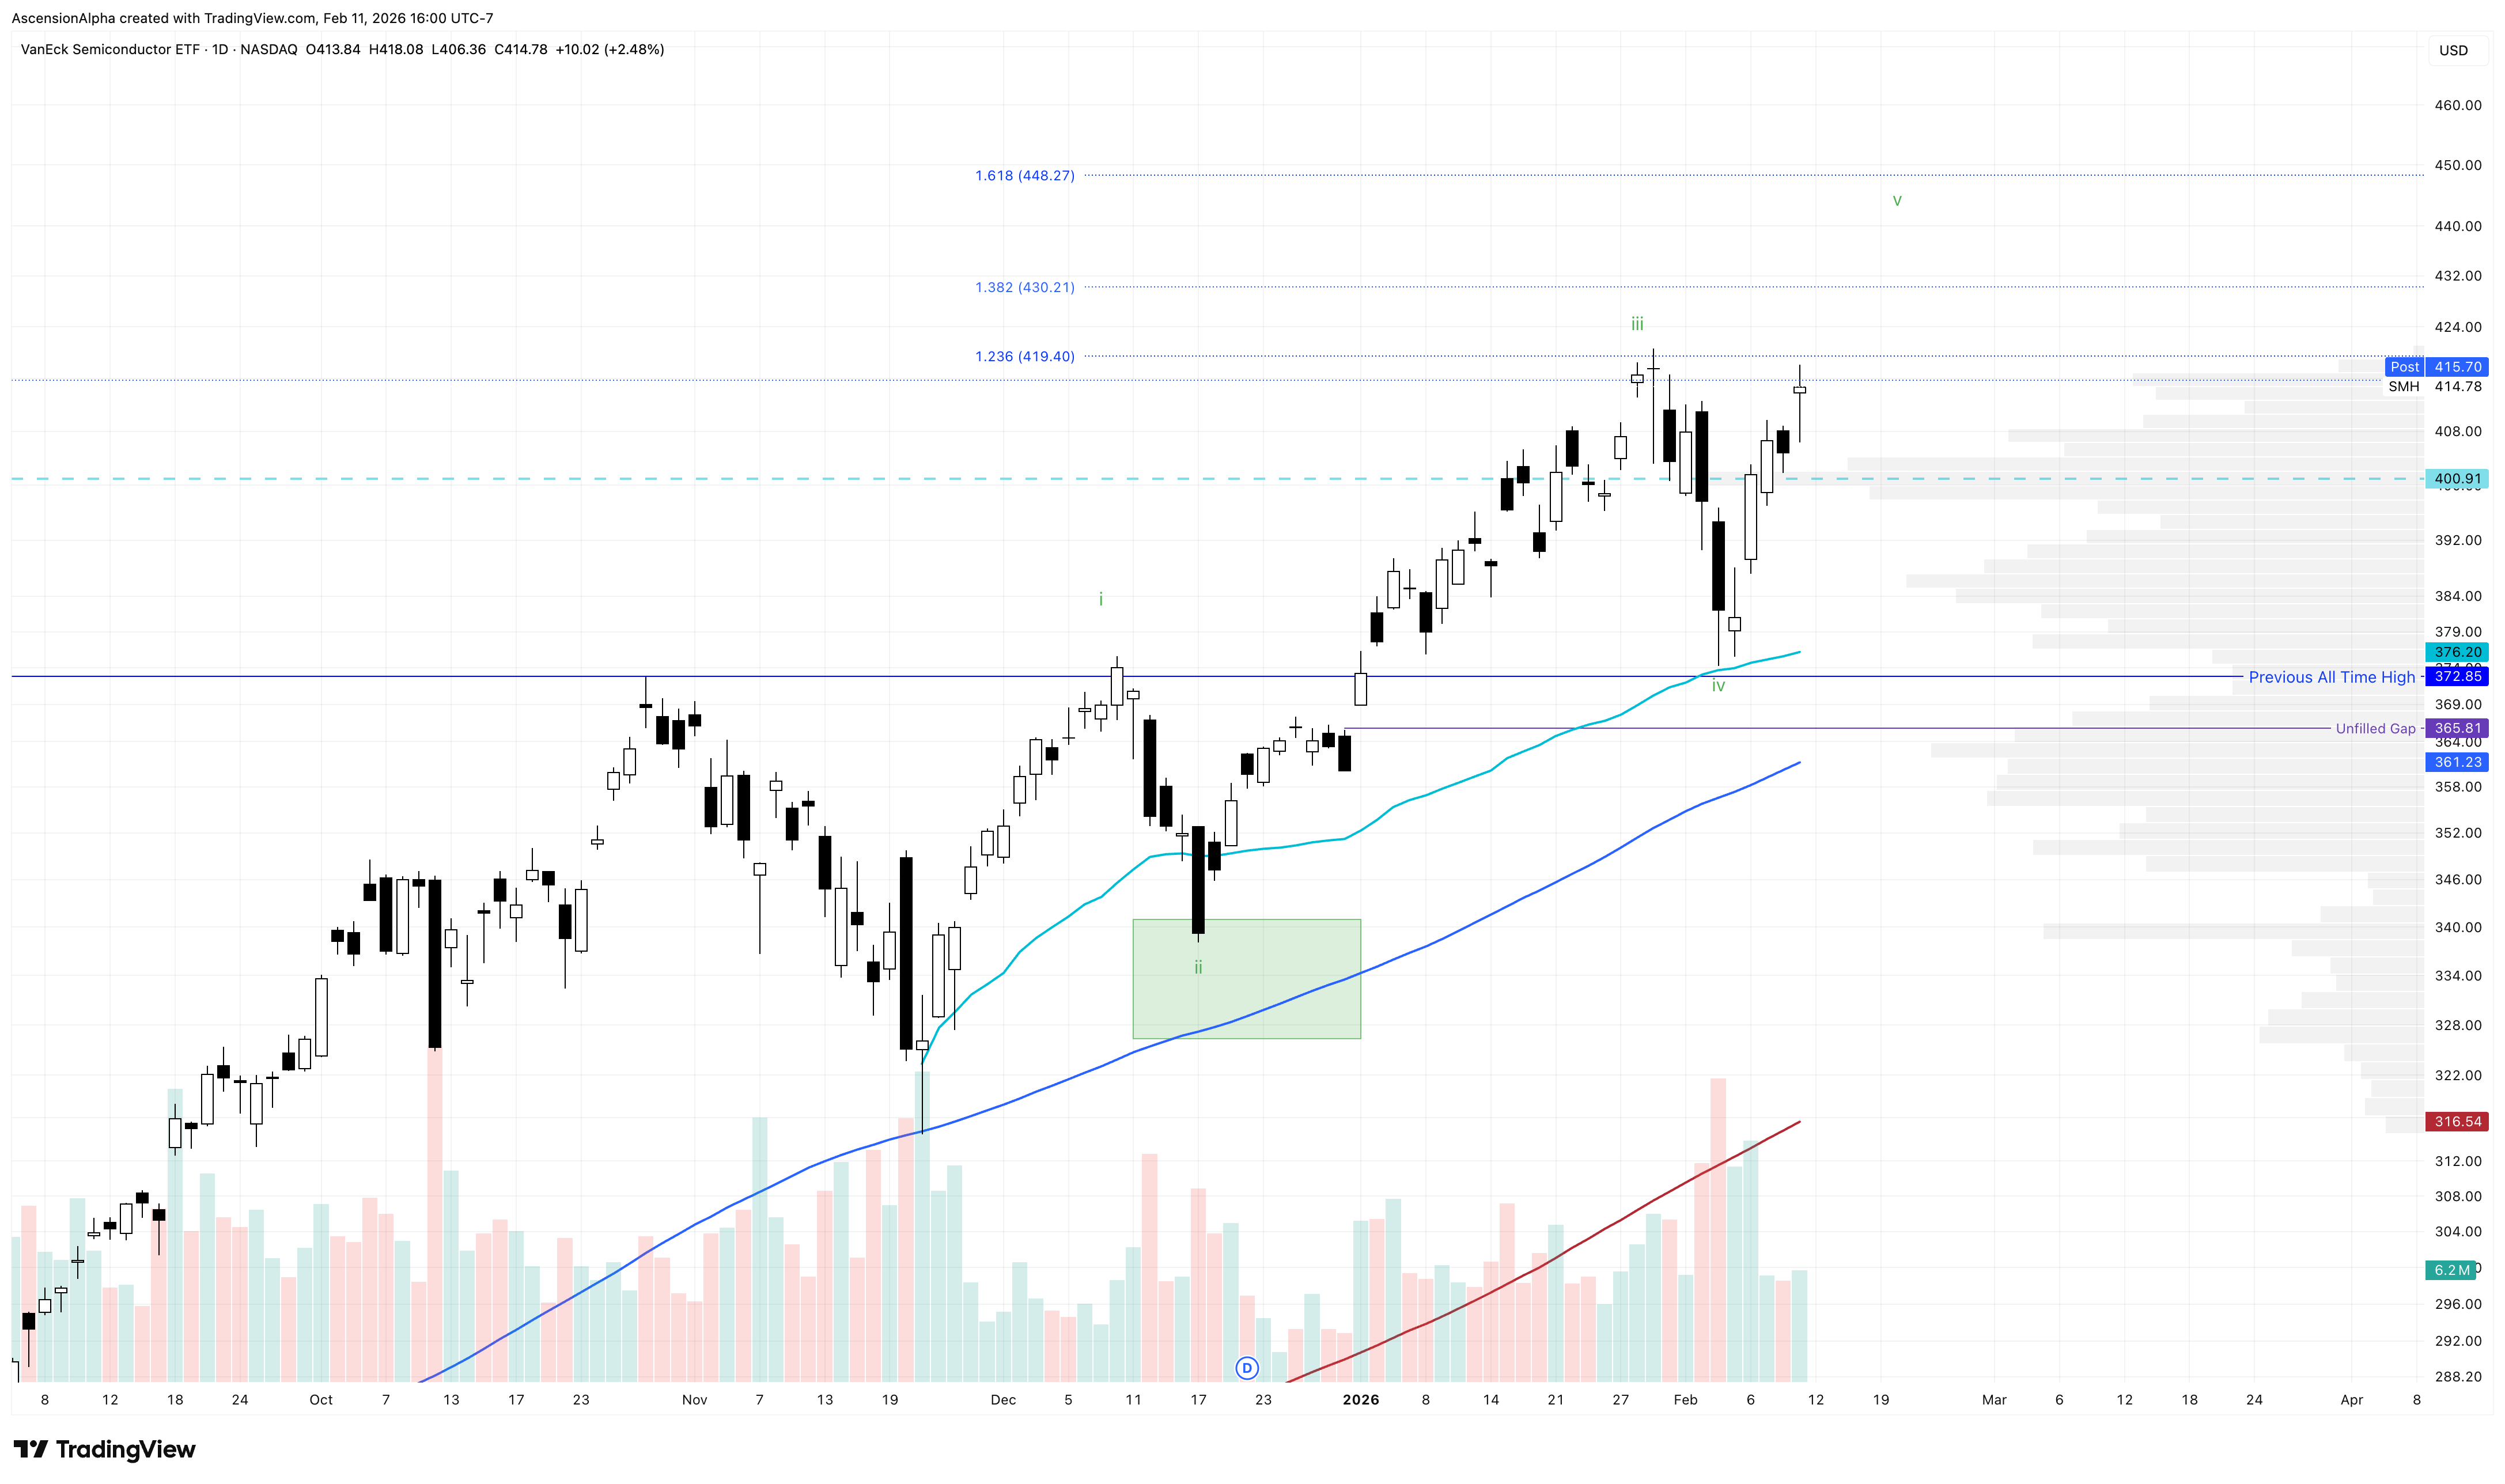
If you pulled up a simple line chart on SPY, QQQ, or DIA, you’d see they’ve done almost nothing this week. All three are sitting at or near last Friday’s close. RSP has moved nicely higher, and SMH has shown relative strength as well, nearly pushing back toward new all-time highs.
SMH Daily Chart
With the major indices chopping sideways and the market clearly bifurcated, this is a tricky environment to navigate in the short term.
I still believe the two most probable scenarios are:
A) A top is very near and volatility increases over the next couple of months, or
B) We get a blow-off move into March or April before a larger correction (Dot Com Analog)
SPY 3 Day Chart

Right now, though, it’s difficult to determine which path is more likely. For every bullish signal, I can find a bearish one. When signals conflict like this, risk is elevated in my book. Markets are always somewhat mixed—but over the past month or two, the divergences have grown more pronounced.
The former darlings of the 2025 bull market are selling off harder than most thought possible. But if you’ve witnessed a high-beta tech unwind before, you know this kind of move doesn’t come out of nowhere. I highlighted the similarities between the February 2021 crash and the October 2025 top as it was unfolding. QQQ still has not made a new high above that October peak, and this weakness hasn’t been limited to high-beta names alone.
TSM is the only Trillion Dollar Titan consistently pushing to new highs without obvious weakness. Even so, it’s starting to look extended—possibly nearing a blow-off move. I’m not interested in shorting it, but a 10%+ pullback before month-end wouldn’t surprise me.
That said, with roughly $600+ billion in projected capex from big tech this year—much of it tied to AI infrastructure—TSM remains critical to the entire buildout. Don’t sleep on it. Short-term extension is one thing; long-term structural demand is another.
TSM 3 Day Chart

GOOGL, previously — and arguably still — one of the stronger big tech leaders, has shown cracks since its last earnings. It initially gapped down 6%, immediately faded, and filled the gap with a powerful high-volume bullish candle. Now it’s threatening to close back below that candle. While a close below wouldn’t be catastrophic—it has the 100-day SMA just underneath—but it would be the first signal that a larger retest may be developing.
Everyone wants to buy GOOGL, so a major selloff doesn’t seem imminent. But if real selling shows up, strong support sits between $260 and $240. Below that is the “Warren Buffett gap” near $212. I don’t expect it soon—but long term, I do think that gap fills. And yes, the alerts are already set.
GOOGL Daily Chart

AMZN is back below its 100-week SMA. NVDA remains stuck under $190 resistance and has essentially moved sideways for nearly 200 days. That said, keep it on your watchlist for quick swings or day trades—if it gaps above $194 in the coming days, it should move quickly toward the $205 gap fill ahead of earnings. MSFT has shown notable weakness and is nearing the 200-week SMA. META is sitting at support with roughly equal upside and downside in the near term.
MSFT 4 Hour Chart

In other words, it’s hard to find a clean short-term edge in tech right now. Patience is key. Wait for key levels. Add slowly. Respect that we are in a choppy season and don’t get too aggressive buying in names that are going straight down.
I have no doubt this weakness in tech—some of which we’re already seeing—will eventually look like a gift in hindsight. I’m adding on weakness to MSFT, GOOGL, NVDA, TSM, AMZN, and META, building positions for their eventual moves higher. Even if more downside comes first—and based on the charts, it looks likely—the long-term opportunity remains intact.
For even more daily edge, check out the video below on NET and ALAB earnings. Both reported earnings on Tuesday and saw large gap moves on Wednesday.
I’d be interested in buying either on further weakness if it comes. ALAB is currently stuck in a VWAP pinch and looks vulnerable to a downside break. If NET loses the low of its high-volume Tuesday candle, it would confirm a pretty aggressive green-to-red move and would signal more weakness to come
Watch the video below for more detailed and actionable insights.